[Preprint]. 2024 Apr 3:2024.04.02.587805.
doi: 10.1101/2024.04.02.587805.

APOBEC shapes tumor evolution and age at onset of lung cancer in smokers

Affiliations

APOBEC shapes tumor evolution and age at onset of lung cancer in smokers

Tongwu Zhang et al. bioRxiv. .

Update in

  • APOBEC affects tumor evolution and age at onset of lung cancer in smokers.
    Zhang T, Sang J, Hoang PH, Zhao W, Rosenbaum J, Johnson KE, Klimczak LJ, McElderry J, Klein A, Wirth C, Bergstrom EN, Díaz-Gay M, Vangara R, Colon-Matos F, Hutchinson A, Lawrence SM, Cole N, Zhu B, Przytycka TM, Shi J, Caporaso NE, Homer R, Pesatori AC, Consonni D, Imielinski M, Chanock SJ, Wedge DC, Gordenin DA, Alexandrov LB, Harris RS, Landi MT. Zhang T, et al. Nat Commun. 2025 May 21;16(1):4711. doi: 10.1038/s41467-025-59923-8. Nat Commun. 2025. PMID: 40394004 Free PMC article.

Abstract

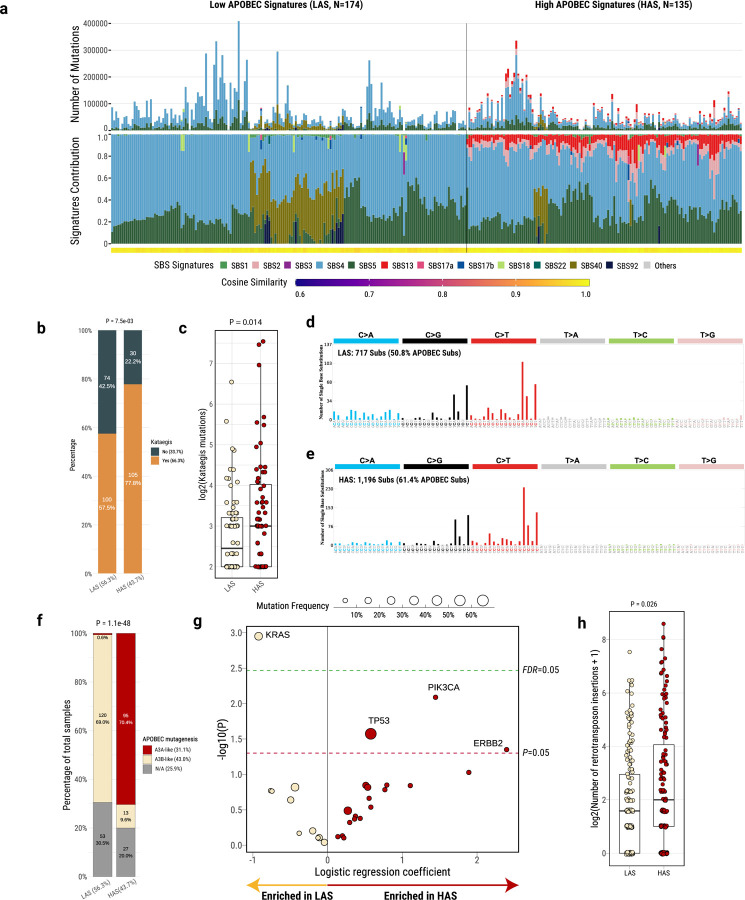
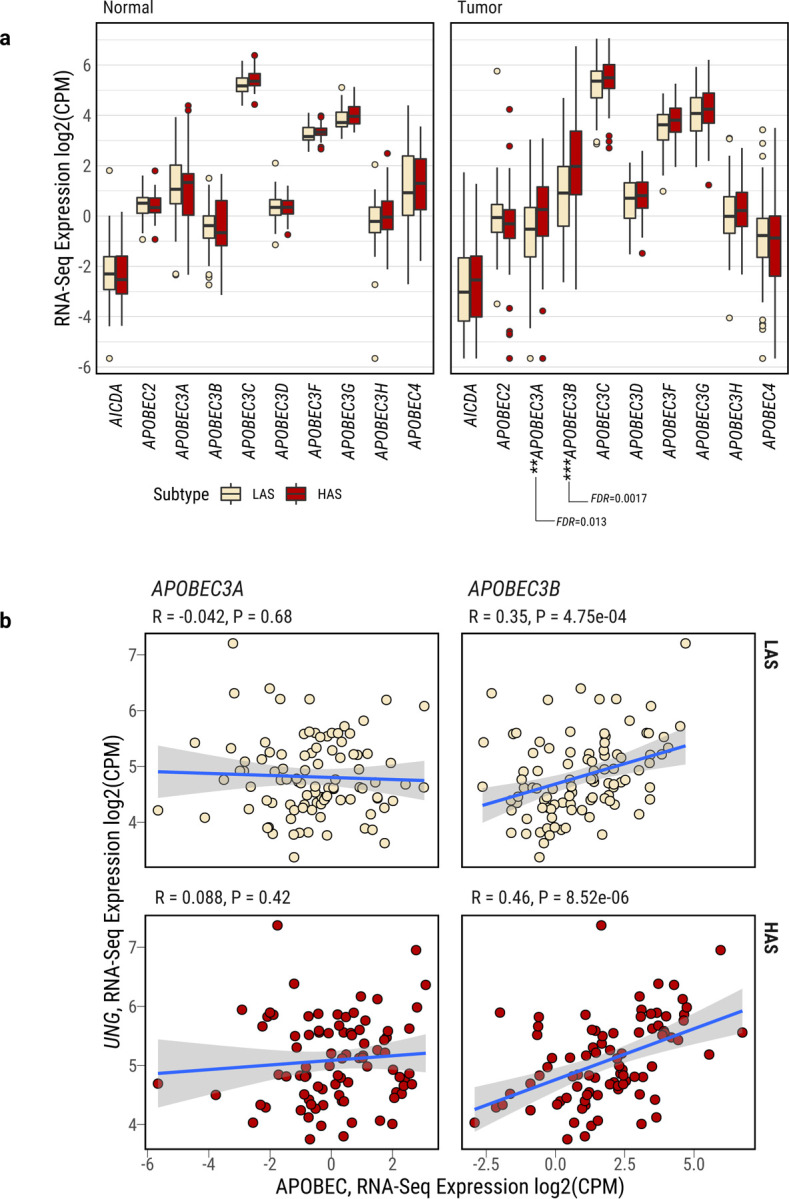
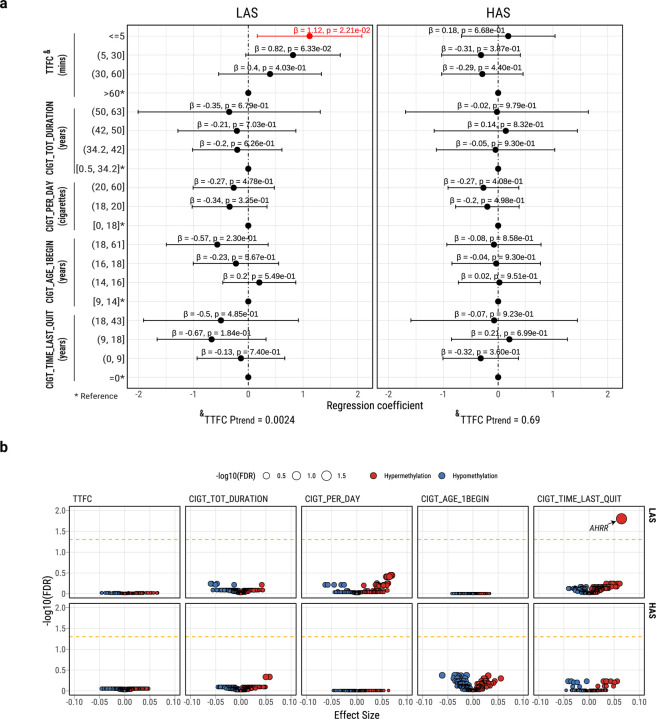
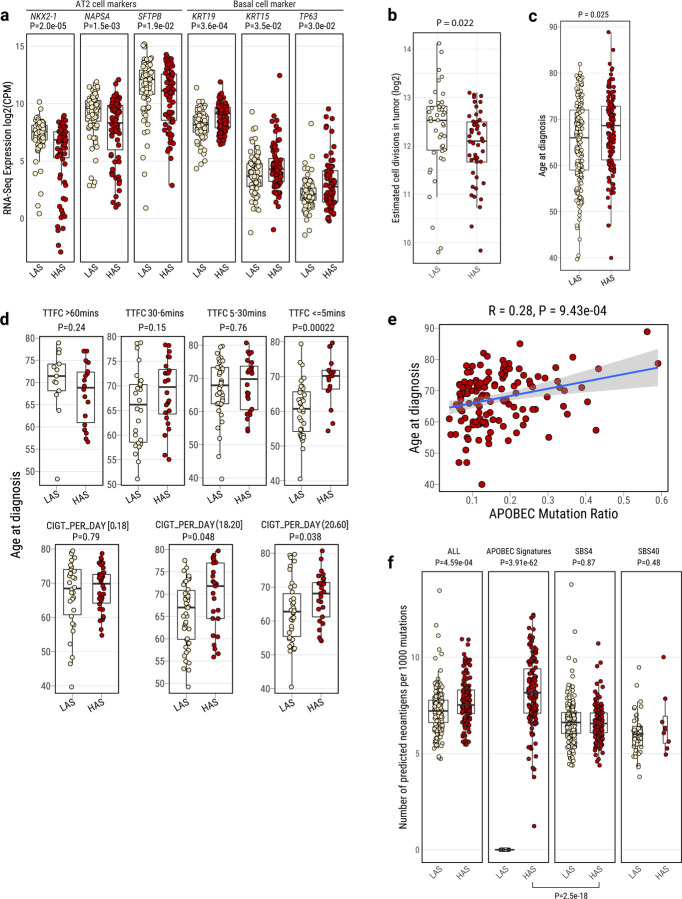
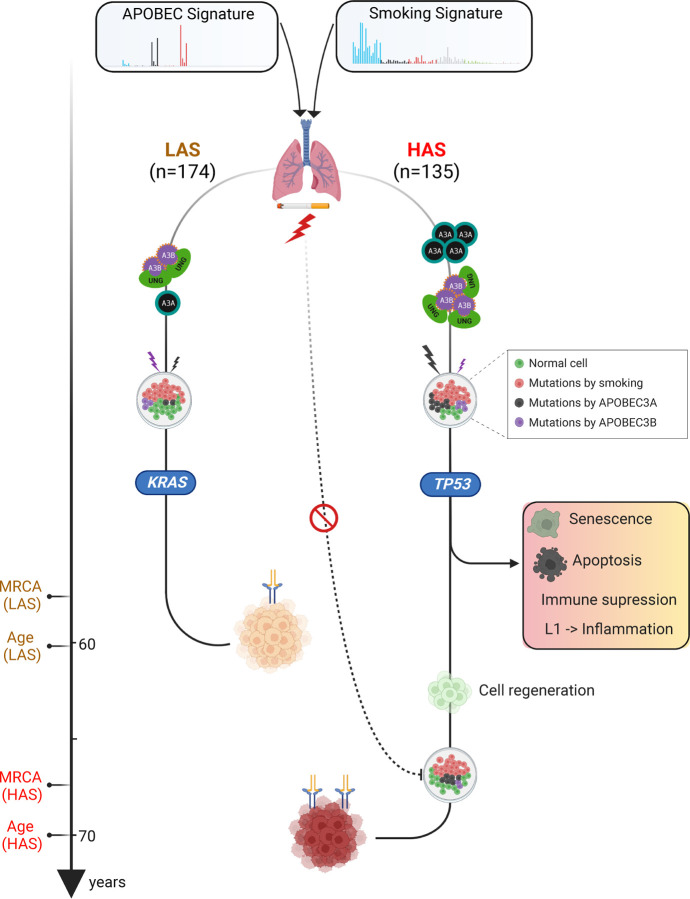
APOBEC enzymes are part of the innate immunity and are responsible for restricting viruses and retroelements by deaminating cytosine residues1,2. Most solid tumors harbor different levels of somatic mutations attributed to the off-target activities of APOBEC3A (A3A) and/or APOBEC3B (A3B)3-6. However, how APOBEC3A/B enzymes shape the tumor evolution in the presence of exogenous mutagenic processes is largely unknown. Here, by combining deep whole-genome sequencing with multi-omics profiling of 309 lung cancers from smokers with detailed tobacco smoking information, we identify two subtypes defined by low (LAS) and high (HAS) APOBEC mutagenesis. LAS are enriched for A3B-like mutagenesis and KRAS mutations, whereas HAS for A3A-like mutagenesis and TP53 mutations. Unlike APOBEC3A, APOBEC3B expression is strongly associated with an upregulation of the base excision repair pathway. Hypermutation by unrepaired A3A and tobacco smoking mutagenesis combined with TP53-induced genomic instability can trigger senescence7, apoptosis8, and cell regeneration9, as indicated by high expression of pulmonary healing signaling pathway, stemness markers and distal cell-of-origin in HAS. The expected association of tobacco smoking variables (e.g., time to first cigarette) with genomic/epigenomic changes are not observed in HAS, a plausible consequence of frequent cell senescence or apoptosis. HAS have more neoantigens, slower clonal expansion, and older age at onset compared to LAS, particularly in heavy smokers, consistent with high proportions of newly generated, unmutated cells and frequent immuno-editing. These findings show how heterogeneity in mutational burden across co-occurring mutational processes and cell types contributes to tumor development, with important clinical implications.


Conflict of interest statement

ETHICS DECLARATIONS LBA is a compensated consultant and has equity interest in io9, LLC. His spouse is an employee of Biotheranostics, Inc. LBA is also an inventor of a US Patent 10,776,718 for source identification by non-negative matrix factorization. ENB and LBA declare U.S. provisional patent applications with serial numbers 63/289,601 and 63/269,033. LBA also declares U.S. provisional patent applications with serial numbers: 63/366,392; 63/367,846; and 63/412,835. All other authors declare no competing interests.

Figures

Fig. 1:
Fig. 1:. Genomic classification and characterization of lung cancer in smokers based on mutational signatures analyses.
a, Landscape of SBS mutational processes and identification of two tumor subtypes based on APOBEC mutational signatures. The landscape of mutational signatures includes a bar plot presenting the total number of mutations assigned to each signature, the proportion of signatures assigned to each sample, and the cosine similarity between the original mutation profile and the signature decomposition. b, Comparisons of kataegis frequency between LAS and HAS tumors. c, Number of mutations in kataegis between LAS and HAS tumors. d,e, Mutational spectrum of total mutations contributing to kataegis in LAS and HAS tumors, respectively. f, Proportions of A3A-like and A3B-like mutagenesis between LAS and HAS tumors. Tumors not enriched with TCA mutations or without significant differences between RTCA and YTCA mutations are classified as N/A. g, Logistic regression analysis between tumor subtypes and nonsynonymous mutation status of driver genes, adjusting for the following covariates: age, sex, histology, TMB, and tumor purity. The significance thresholds P<0.05 (red) and FDR<0.05 (green) are indicated by the dashed lines. h, Number of retrotransposon insertions between LAS and HAS tumors.
Fig. 2:
Fig. 2:. Characterization of APOBEC3A and APOBEC3B expression in lung cancers from smokers.
a, Differentially expressed APOBEC family genes between LAS and HAS in both normal and tumor samples. After multiple testing corrections based on the Benjamini–Hochberg method, only APOBEC3A and APOBEC3B show significant differential expression between LAS and HAS tumors. Of note, APOBEC1 expression was extremely low across most tumor samples, thus it is not included in the analysis. b, Gene expression correlation between UNG and APOBEC3A (left) or APOBEC3B (right), stratified by LAS (top) and HAS (bottom) tumors. Significant P-values and Pearson correlation coefficients are shown on top of each scatter plot.
Fig. 3:
Fig. 3:. Multivariate regression analysis between five tobacco smoking variables and genomic (n=198) or epigenomic (n=122) features in the EAGLE samples.
a, Forest plot for the associations between TMB and smoking variables, stratified between LAS and HAS tumors. P-values and regression coefficients with 95% confidence intervals (CIs) are shown for each category of smoking variables. Significant associations are in red ink. Trend test P values (Ptrend) from associations between TTFC and TMB are included below the forest plots. b, Volcano plots of the associations between smoking variables and methylation levels of known smoking-related CpG probes in tumors. Association FDR values (adjusted using the Benjamini-Hochberg method) are shown on the y-axis. The orange dashed line indicates the associations with FDR<0.05. The CpG probes associated with tobacco smoking are derived from a study comparing methylation levels between smokers and never smokers in normal lung tissue. The size and color of each point represent the FDR and association direction, respectively. All association analyses are adjusted for the following covariates: age, sex, histology, and tumor purity.
Fig. 4:
Fig. 4:. Tumor cell composition and age at onset differences between LAS and HAS tumors.
a, Boxplots show the differentially expressed gene markers of lung-specific cell types between LAS and HAS LUAD tumors (n=155). b, Cumulative number of stem cell division estimates in LAS and HAS tumors based on methylation data. c,d, Age at diagnosis difference between LAS and HAS tumors overall (c), and (d) stratified by TTFC [Time to first cigarette in the morning (from the first question of the Fagerstrom test for nicotine dependence: ‘How soon after you wake up do you smoke your first cigarette?’)] or CIGT_PER_DAY (Average intensity of cigarette smoking, measured as the number of cigarettes per day). e, Correlation between APOBEC mutation ratio and age at diagnosis in HAS tumor. f, Neoantigen prediction for different mutational signatures between LAS and HAS. P-values from Wilcoxon rank-sum tests are labeled for each boxplot. On the bottom, P-value for the different contribution of SBS4 and APOBEC mutational signatures to neoantigen prediction in HAS tumors.
Fig. 5
Fig. 5. Conceptual diagram of APOBEC shaping tumor development and influencing age at onset of lung cancers from smokers.
The schematic was generated using BioRender (https://biorender.com/).

Similar articles

References

    1. Mertz T. M., Collins C. D., Dennis M., Coxon M. & Roberts S. A. APOBEC-Induced Mutagenesis in Cancer. Annu. Rev. Genet. (2022) doi:10.1146/annurev-genet-072920-035840. - DOI - PubMed
    1. Pecori R., Di Giorgio S., Paulo Lorenzo J. & Nina Papavasiliou F. Functions and consequences of AID/APOBEC-mediated DNA and RNA deamination. Nat. Rev. Genet. (2022) doi:10.1038/s41576-022-00459-8. - DOI - PMC - PubMed
    1. Roberts S. A. et al. An APOBEC cytidine deaminase mutagenesis pattern is widespread in human cancers. Nat. Genet. 45, 970–976 (2013). - PMC - PubMed
    1. Alexandrov L. B. et al. The repertoire of mutational signatures in human cancer. Nature 578, 94–101 (2020). - PMC - PubMed
    1. Degasperi A. et al. Substitution mutational signatures in whole-genome-sequenced cancers in the UK population. Science 376, (2022). - PMC - PubMed

Publication types