. 2024 Mar 25;20(6):2202-2218.
doi: 10.7150/ijbs.82361. eCollection 2024.

PTPLAD1 Regulates PHB-Raf Interaction to Orchestrate Epithelial-Mesenchymal and Mitofusion-Fission Transitions in Colorectal Cancer

Affiliations

PTPLAD1 Regulates PHB-Raf Interaction to Orchestrate Epithelial-Mesenchymal and Mitofusion-Fission Transitions in Colorectal Cancer

Zi-Jia Huang et al. Int J Biol Sci. .

Abstract

Colorectal cancer (CRC) remains one of the leading causes of cancer-related death worldwide. The poor prognosis of this malignancy is attributed mainly to the persistent activation of cancer signaling for metastasis. Here, we showed that protein tyrosine phosphatase-like A domain containing 1 (PTPLAD1) is down-regulated in highly metastatic CRC cells and negatively associated with poor survival of CRC patients. Systematic analysis reveals that epithelial-to-mesenchymal transition (EMT) and mitochondrial fusion-to-fission (MFT) transition are two critical features for CRC patients with low expression of PTPLAD1. PTPLAD1 overexpression suppresses the metastasis of CRC in vivo and in vitro by inhibiting the Raf/ERK signaling-mediated EMT and mitofission. Mechanically, PTPLAD1 binds with PHB via its middle fragment (141-178 amino acids) and induces dephosphorylation of PHB-Y259 to disrupt the interaction of PHB-Raf, resulting in the inactivation of Raf/ERK signaling. Our results unveil a novel mechanism in which Raf/ERK signaling activated in metastatic CRC induces EMT and mitochondrial fission simultaneously, which can be suppressed by PTPLAD1. This finding may provide a new paradigm for developing more effective treatment strategies for CRC.

Keywords: Colorectal cancer; ERK; Epithelial-to-mesenchymal transition; Metastasis; Mitofission; PHB; PTPLAD1; Raf.


Conflict of interest statement

Competing Interests: The authors have declared that no competing interest exists.

Figures
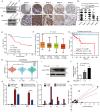
Figure 1
Figure 1
PTPLAD1 is decrease in highly metastatic cancer cells and tissues and negatively associated with poor prognosis in CRC. (A, B) The expression of PTPLAD1 in FHs74Int, SW480, SW620 (A), HCT116 and HCT116-i8 cells (B) was examined by western blotting assays. (C, D) The representative IHC images of PTPLAD1 staining in normal tissues and different stages (Stage 1-4) of CRC tissues (D). Bars, S.D.; n.s., no significant, *p < 0.05, ** p < 0.01, *** p < 0.001, compared with the staining score of stage 1 or normal as indicated (D). (E) Kaplan-Meier survival analysis of CRC patients according to the expression of PTPLAD1 by using median expression level as the cut-off point for survival analyses. High PTPLAD1 expression is significantly correlated with longer survival, and statistical significance was calculated by log-rank test (p = 0.0006). (F) The expression of PTPLAD1 was analyzed by using in TCGA-COAD, the expression level of PTPLAD1 was negatively correlated with individual cancer stages (tumor samples classified to stage1, stage2, stage3, and stage4). (G) The expression of PTPLAD1 in N0, N1 and N2 was analyzed by using in TCGA-COREAD. (H) Disease free survival analysis of TCGA-COAD patients according to the expression of PTPLAD1. (I, J) The effect of acetylation of histone H3K9 on the expression of PTPLAD1 in HCT116 cells. HCT116 cells were treated with DMSO or TSA (0.5 μM or 1 μM, 24 h), the acetylation status of histone H3K9 was determined by western blotting (I), and the transcription level of the PTPLAD1 gene was evaluated by qRT-PCR (J). (K) HCT116 and RKO cells were treated with DMSO or TSA (1 μM, 24 h), ChIP assays were performed by using acetylated H3K9 antibody or IgG control, and the PTPLAD1 promoter signal was detected by qRT-PCR. (L) ChIP assays were performed by using acetylated H3K9 antibodies in tumor tissues (T) and corresponding normal tissues (N), and the PTPLAD1 promoter signal was detected by qRT-PCR (n = 4). (M) The acetylation level of H3K9 and the expression level of PTPLAD1 in clinical tissues were detected by western blotting and qRT-PCR, respectively, and the correlation of H3K9 acetylation and PTPLAD1 expression was analyzed by correlation analysis (n = 15). Bars, S.D.; n.s., no significant, * p < 0.05, ** p < 0.01, as compared with the control group.
Figure 2
Figure 2
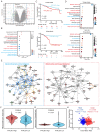
Systematic analysis of the DEGs in CRC patients with PTPLAD1-high and PTPLAD1-low. (A) The PTPLAD1-regulated differentially expressed genes (DEGs) in RKO cells were analyzed by RNA-Seq, the up-regulated genes (red) and down-regulated genes (green) were displayed by volcano plots. (B) KEGG enrichment analysis of the DEGs between RKO-PTPLAD1 and RKO-Ctrl. (C) Kaplan-Meier survival analysis of TCGA-COAD and TCGA-READ patients according to the expression of PTPLAD1 by using optimal cut-off point for survival analyses. High PTPLAD1 expression is significantly correlated with longer survival in both COAD and READ, and statistical significance was calculated by log-rank test. (D) KEGG enrichment analysis of the DEGs in both COAD and READ. (E) IPA analysis the networks of overlapped genes between COAD and READ. (F, G) The mitochondrial Fusion/Fission Ratio (F) and Mesenchymal/Epithelial Ratio (G) in dataset combined COAD and READ were compared. (H) Correlation analysis of mitochondrial Fusion/Fission Ratio and Mesenchymal/Epithelial Ratio in COAD (p = 0.0108, Pearson r = -0.13) and READ (p = 0.008, Pearson r = -0.26) respectively.
Figure 3
Figure 3
PTPLAD1 suppresses CRC cell mitofission and metastasis. (A) Electron micrographs of mitochondria in RKO cells transfected with empty vector or PTPLAD1-flag. Mitochondria in tubular, short tubular and fragment were statistically analyzed (n = 3). Scale bar, 1 μm in the left panels. (B) Mitochondrial morphology was visualized using MitoTracker probe in the indicated cells. Scale bars, 5 μm; (C) Expression levels of p-Drp1, Drp1, Fis1, OPA1, MFN1 and MFN2 in HCT116 and RKO cells with overexpression or knockdown of PTPLAD1 were determined by immunoblot. HCT116 and RKO cells were transfected with empty vector or PTPLAD1-flag, as well as with si-Ctrl or two siRNAs against PTPLAD1 (si-PTPLAD1-#1 or si-PTPLAD1-#2), and the cell lysates were subjected to immunoblotting analysis. (D, E) The effect of PTPLAD1 in CRC invasion. HCT116 and RKO cells were transfected with PTPLAD1-expressing plasmids (D) or siRNAs against PTPLAD1 (100 nM) (E), as well as the corresponding control vector or si-Ctrl. Then the invasion ability of these cells was evaluated by Boyden chamber invasion assays. Scale bar, 100 μm. (F, G) The expression of EMT markers in HCT116 and RKO cells transfected with PTPLAD1-expressing plasmids (F) or siRNAs (G) were determined by western blotting. (H, I) HCT116 cells with stable PTPLAD1 expression (H) or PTPLAD1 knockdown (I), as well as the corresponding control cells, were injected into mice intravenously. The mice were euthanized 4 weeks after injected, and the lung and kidney were isolated for counting the metastatic tumor nodes. Left, images of organs; right, statistics of tumor nodes in organs; 5 mice were used in each experimental group. Bars, S.D.; *p < 0.05, ** p < 0.01, *** p < 0.001 compared with the control group.
Figure 4
Figure 4
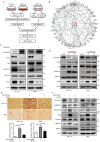
PTPLAD1 suppresses the activation of the Raf/ERK/Snail signaling cascades. (A) The workflow of IP-MS assay on determining PTPLAD1 binding partners/substrate. Anti-p-Tyr antibody was used for the enrichment of the lysates from HCT116 with (heavy chain) or without (light chain) PTPLAD1-KD. In addition, Co-IP assay against PTPLAD1-flag was performed by using a flag-tagged antibody, and the immunoprecipitated proteins were identified by mass spectrometry and ingenuity pathway analysis (B). (C, D) HCT116 and RKO cells were transfected with PTPLAD1-flag plasmids (C) or siRNAs against PTPLAD1 (D) and the corresponding controls. The expression of PTPLAD1, Raf, ERK1/2 and snail, as well as the p-Raf and p-ERK1/2, were determined by western blotting. (E, F) HCT116 and RKO cells were transfected with a siRNA against PTPLAD1 with or without the presence of U0126, the invasion ability of HCT116 and RKO cells was evaluated by Boyden chamber invasion assays (E). Scale bar, 100 μm; Histogram, statistics of invaded cells; Data are presented from three independent experiments; Bars, S.D.; * p < 0.05; ** p < 0.01; *** p < 0.001 compared with the indicated group; and the expressions of E-cadherin, fibronectin, snail, vimentin and p-ERK1/2 were detected by western blotting (F).
Figure 5
Figure 5
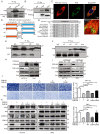
PTPLAD1 interacts with PHB through the middle peptide and C-terminus. (A, B) HCT116 cells were transfected with PTPLAD1-flag or PHB-flag plasmids, Co-IP assays were performed by using a flag antibody, and the expression of PHB (A) and PTPLAD1 (B) were detected by western blotting. (C) HCT116 cells were transfected with PTPLAD1-mCherry plasmids, and stained with PHB antibody, the subcellular localization of PTPLAD1 and PHB was performed by confocal analysis. PHB, green; PTPLAD1, red; DAPI was used to stain the nuclei. Scale bar, 2 μm. (D) Schematic diagrams of PTPLAD1 mutants including cs domain deletion(ΔN), M fragment deletion(ΔM) and PTPLA domain deletion (ΔC). (E) HCT116 cells were transfected with PTPLAD1-flag or ΔM-flag plasmids, Co-IP assays were performed by using a flag antibody, and the expression of PHB was detected by western blotting; IgG was considered as loading control. (F) HCT116 cells were transfected with ΔC, ΔM or PTPLAD1-flag (WT) plasmids individually, Co-IP assays were performed by using a flag antibody, and the expression of PHB was determined by western blotting. IgG was considered as loading control. (G) Alignment of the consensus M fragment sequence with amino acids 141-178 of human PTPLAD1 and the corresponding sequence from the indicated species. (H, I) HCT116 and RKO cells were transfected with PTPLAD1-expressing plasmids (H) or siRNAs against PTPLAD1 (I) and the corresponding vector controls, and the expression of PTPLAD1 and PHB, as well as PHB-Y259, were determined by western blotting. (J, K) PHB-deficient HCT116 and RKO cells were transiently transfected with PHBwt, PHBY259A, PHBY259D plasmids respectively, and the invasion ability of these cells was evaluated by Boyden chamber invasion assays (J), Scale bar, 100 μm; the expression of PHB, Raf, ERK1/2, as well as the activation status of Raf and ERK1/2 were detected by western blotting (K). Bars, S.D.; * p < 0.05, ** p < 0.01, *** p < 0.001, ns, not significant.
Figure 6
Figure 6
PHB is required for PTPLAD1-mediated ERK signaling activation. (A) Representative TEM images of RKO transfected with PTPLAD1 and/or PHB for 48 h, and the mitochondrial morphology with tubular and fragment were statistically analyzed (n = 3). Scale bars, 1 μm. (B) Mitochondrial morphology was visualized using MitoTracker probe in the indicated cells, and the mitochondrial morphology with tubular and fragment were statistically analyzed (n = 3) Scale bars, 5 μm. (C) Immunoblotting analysis of the expression levels of p-Drp1, Drp1, Fis1, OPA1, MFN1 and MFN2 in HCT116 and RKO cell with indicated transfection. (D, E) HCT116 and RKO cells were transfected with PTPLAD1-expressing plasmids alone or co-transfected with PHB-expressing plasmids, the invasion ability of cells was evaluated by Boyden chamber invasion assays (D), scale bar, 100 μm, and the expression of PTPLAD1, Raf, ERK1/2, PHB and Snail, as well as the activation status of Raf, ERK1/2 and PHB, were detected by western blotting (E). Bars, S.D.; * p < 0.05, ** p < 0.01, *** p < 0.001.
Figure 7
Figure 7
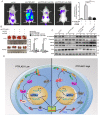
PHB/Raf/ERK pathway-mediated EMT and MFT is required for PTPLAD1-regulated CRC metastasis. (A-C) Knockdown of PHB or treatment of U0126 restored the pro-metastatic effect of PTPLAD1 deficiency. Bioluminescence imaging (A) and quantification of lung and kidney metastasis in NCG mice that were intravenously injected with HCT116-luci cells expressing sh-PTPLAD1, sh-PHB or sh-Ctrl, and indicated treatment. The lungs and kidneys were excised for imaging, and the metastatic nodules in lungs and kidneys were quantified (B). Bars, SD; n = 3; *p < 0.05; ***p < 0.001. Black circle, metastatic nodules. (C) The protein levels of EMT markers (E-cadherin and vimentin) and MFT markers (MFN1, MFN2 and Fis1) in lungs of above treated NCG mice were determined by western blotting. (D) Schematic diagram summarizing the role of PTPLAD1 in suppressing CRC metastasis. Briefly, PTPLAD1 is upregulated in low metastatic CRC by H3K9 acetylation, and the expression of PTPLAD1 represses the PHB/Raf/ERK signaling pathway by dephosphorylating PHB at Y259 and finally induces the suppression of epithelial-to-mesenchymal transition and mitochondrial fusion-to-fission transition.

References

    1. Wang Y, Zhang J, Li YJ, Yu NN, Liu WT, Liang JZ. et al. MEST promotes lung cancer invasion and metastasis by interacting with VCP to activate NF-kappaB signaling. Journal of experimental & clinical cancer research: CR. 2021;40:301. - PMC - PubMed
    1. Courtois G, Gilmore TD. Mutations in the NF-kappaB signaling pathway: implications for human disease. Oncogene. 2006;25:6831–43. - PubMed
    1. Sung H, Ferlay J, Siegel RL, Laversanne M, Soerjomataram I, Jemal A. et al. Global Cancer Statistics 2020: GLOBOCAN Estimates of Incidence and Mortality Worldwide for 36 Cancers in 185 Countries. CA Cancer J Clin. 2021;71:209–49. - PubMed
    1. Lamouille S, Xu J, Derynck R. Molecular mechanisms of epithelial-mesenchymal transition. Nature reviews Molecular cell biology. 2014;15:178–96. - PMC - PubMed
    1. Phan TTT, Lin YC, Chou YT, Wu CW, Lin LY. Tumor suppressor p53 restrains cancer cell dissemination by modulating mitochondrial dynamics. Oncogenesis. 2022;11:26. - PMC - PubMed