. 2024 Mar 25;3(4):pgae126.
doi: 10.1093/pnasnexus/pgae126. eCollection 2024 Apr.

Host-microbiome associations in saliva predict COVID-19 severity

Affiliations

Host-microbiome associations in saliva predict COVID-19 severity

Hend Alqedari et al. PNAS Nexus. .

Abstract

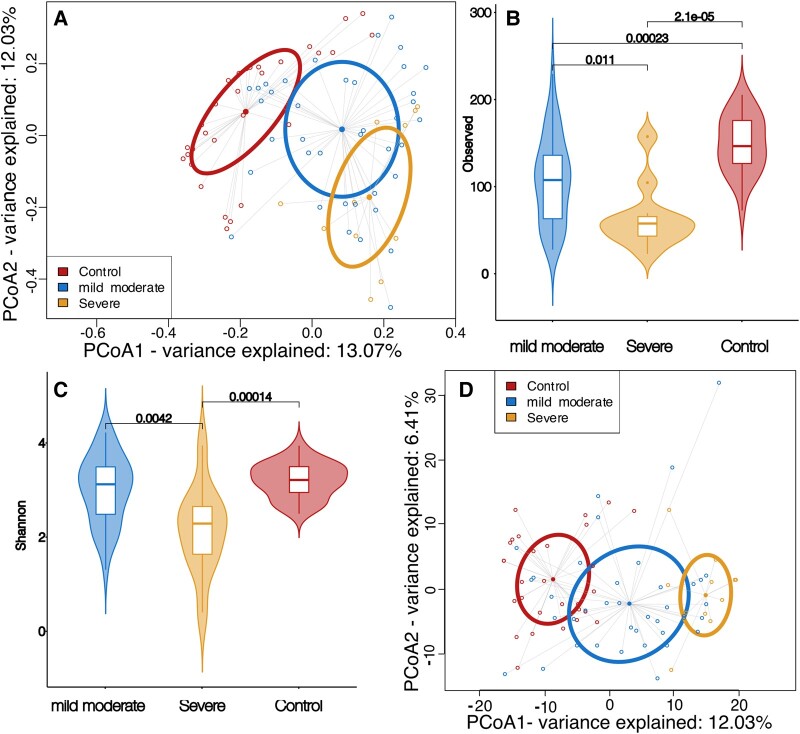
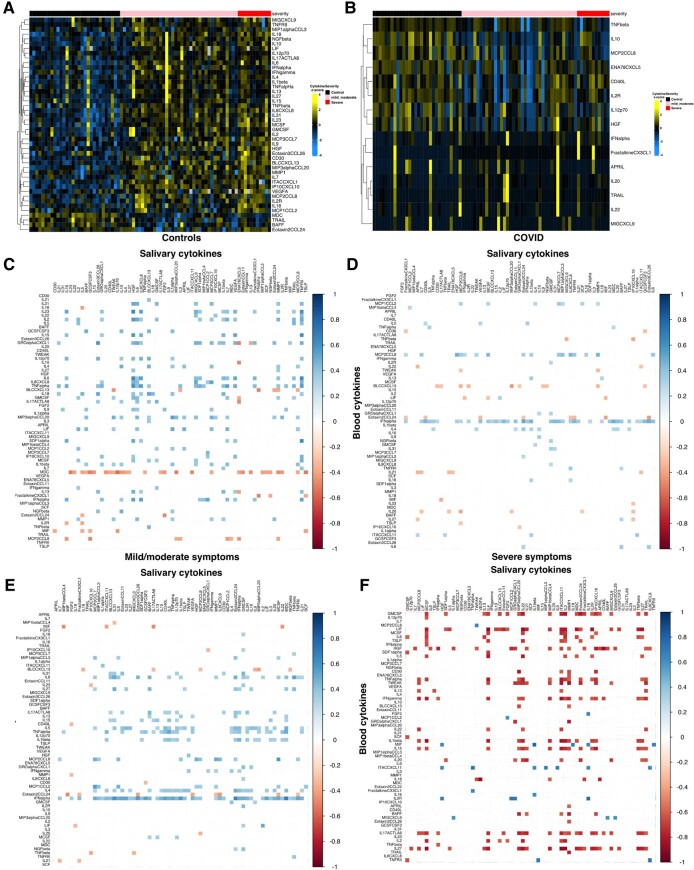
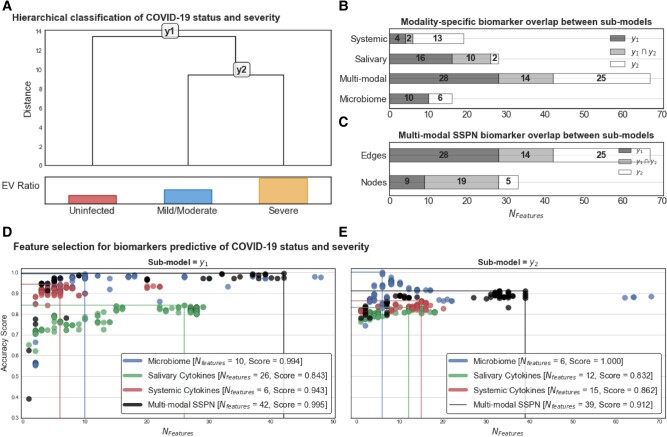
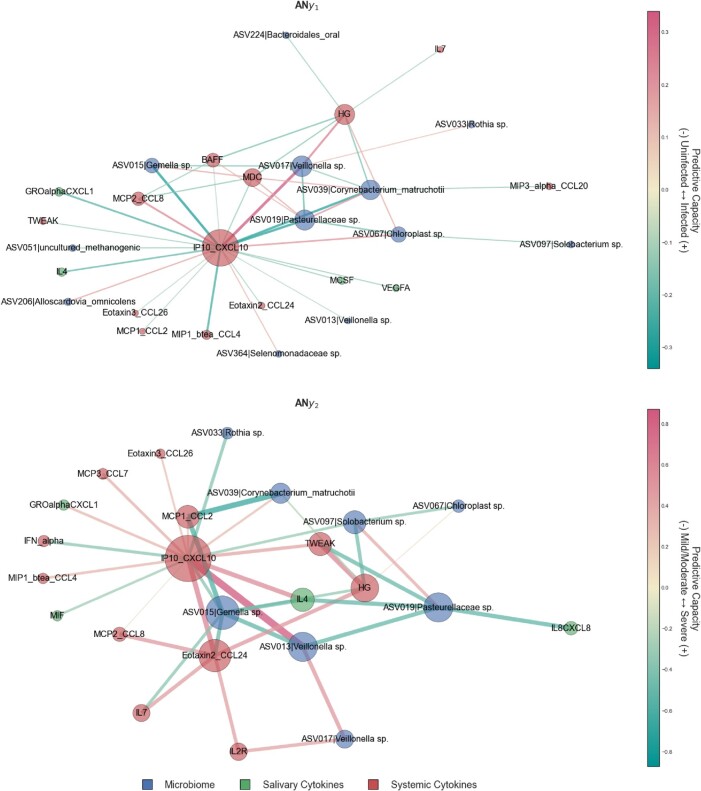
Established evidence indicates that oral microbiota plays a crucial role in modulating host immune responses to viral infection. Following severe acute respiratory syndrome coronavirus 2, there are coordinated microbiome and inflammatory responses within the mucosal and systemic compartments that are unknown. The specific roles the oral microbiota and inflammatory cytokines play in the pathogenesis of coronavirus disease 2019 (COVID-19) are yet to be explored. Here, we evaluated the relationships between the salivary microbiome and host parameters in different groups of COVID-19 severity based on their oxygen requirement. Saliva and blood samples (n = 80) were collected from COVID-19 and from noninfected individuals. We characterized the oral microbiomes using 16S ribosomal RNA gene sequencing and evaluated saliva and serum cytokines and chemokines using multiplex analysis. Alpha diversity of the salivary microbial community was negatively associated with COVID-19 severity, while diversity increased with health. Integrated cytokine evaluations of saliva and serum showed that the oral host response was distinct from the systemic response. The hierarchical classification of COVID-19 status and respiratory severity using multiple modalities separately (i.e. microbiome, salivary cytokines, and systemic cytokines) and simultaneously (i.e. multimodal perturbation analyses) revealed that the microbiome perturbation analysis was the most informative for predicting COVID-19 status and severity, followed by the multimodal. Our findings suggest that oral microbiome and salivary cytokines may be predictive of COVID-19 status and severity, whereas atypical local mucosal immune suppression and systemic hyperinflammation provide new cues to understand the pathogenesis in immunologically compromised populations.

Keywords: COVID-19; host-microbial; inflammatory cytokines; machine learning; saliva microbiome.


Figures

Fig. 1.
Fig. 1.
Analysis of salivary microbiome between the three groups, control (red), mild/moderate (blue), and severe (yellow). A) Principal coordinates analysis (PCoA) of Jaccard dissimilarity demonstrating the three clusters formed by the microbial constituents. Ellipsoids show the first standard deviation of spread of each group (P < 0.05, ADONIS). B) Violin plots of observed features diversity between the three groups (P < 0.05, Wilcoxon rank-sum test). C) Violin plots of Shannon diversity between the three groups (P < 0.05, Wilcoxon rank-sum test). D) Principal coordinates analysis (PCoA) of Euclidean distances of PhILR distances, demonstrating the three clusters between the conditions.
Fig. 2.
Fig. 2.
Heatmaps of salivary and blood cytokines showing statistical significance and positive and negative correlations. A and B) Groups for control (black/left group), mild/moderate (pink/middle group), and severe (red/right group) show statistical significance by Kruskal–Wallis for blood (A) and saliva (B) cytokines. C–F) Correlogram between blood (rows) and salivary (columns) cytokines for controls (C), all COVID patients (D), mild/moderate category (E), and severe category (F). Significant correlations areas were colored postively (blue) and negatively (red) both with high contrast after the Spearman correlation Rho. Any correlation did not show statistical significance (P > 0.05) was removed and replaced with a white square (low contrast). See Table S4 for the full list of cytokines.
Fig. 3.
Fig. 3.
Hierarchical feature selection for identifying biomarkers predictive of COVID-19 severity. A) Hierarchical classification of COVID severity and the submodels with relative explained variance of each group derived from first principal component of principal component analysis (PCA). Modality-specific biomarker overlap between submodels of B) abundance-based paradigms and C) inferred-interaction paradigms. In the inferred interaction paradigm, features are edges in the SSPN which can be decomposed into nodes which is not the case for the abundance-based paradigms in (B). Clairvoyance feature selection results for D) submodel y1 and E) submodel y2 color coordinated by modality. Each marker on the scatter plot represents a unique hyperparameter/feature set combination that yields a specific accuracy using 10-fold cross-validation repeated with 10 different random states.
Fig. 4.
Fig. 4.
Aggregate network representations of fitted submodels showcasing predictive capacity—aggregate network for submodel (A) y1 and (B) y2. The edge weights can be interpreted as predictive capacity for COVID severity. For y1, positive values indicate that an increase in perturbation results in an increased likelihood that a sample is classified as y2 (i.e. infected) relative to uninfected. For y2, positive values indicate that an increase in perturbation results in an increased likelihood that a sample is classified as severe relative to mild/moderate. Node size is proportional to weighted degree as a measurement of network connectivity and, by extension, biomarker importance. C) ASVs in the SSPN as proportions of presence in the various conditions, demonstrating that the majority of the ASVs are due to differences in abundances of common taxa across all conditions, and not rare species.

Update of

References

    1. Moutsopoulos NM, Konkel JE. 2018. Tissue-specific immunity at the oral mucosal barrier. Trends Immunol. 39(4):276–287. - PMC - PubMed
    1. Şenel S. 2021. An overview of physical, microbiological and immune barriers of oral mucosa. Int J Mol Sci. 22(15):7821. - PMC - PubMed
    1. Salzano FA, et al. 2018. Microbiota composition and the integration of exogenous and endogenous signals in reactive nasal inflammation. J Immunol Res. 2018:2724951. - PMC - PubMed
    1. Zhu F, et al. 2022. ACE2 and TMPRSS2 in human saliva can adsorb to the oral mucosal epithelium. J Anat. 240(2):398–409. - PMC - PubMed
    1. Haran JP, et al. 2021. Inflammation-type dysbiosis of the oral microbiome associates with the duration of COVID-19 symptoms and long COVID. JCI Insight. 6(20):e152346. - PMC - PubMed