. 2024;5(1):9.
doi: 10.1186/s43074-024-00123-w. Epub 2024 Apr 10.

Brillouin microscopy monitors rapid responses in subcellular compartments

Affiliations

Brillouin microscopy monitors rapid responses in subcellular compartments

Zachary N Coker et al. Photonix. 2024.

Abstract

Measurements and imaging of the mechanical response of biological cells are critical for understanding the mechanisms of many diseases, and for fundamental studies of energy, signal and force transduction. The recent emergence of Brillouin microscopy as a powerful non-contact, label-free way to non-invasively and non-destructively assess local viscoelastic properties provides an opportunity to expand the scope of biomechanical research to the sub-cellular level. Brillouin spectroscopy has recently been validated through static measurements of cell viscoelastic properties, however, fast (sub-second) measurements of sub-cellular cytomechanical changes have yet to be reported. In this report, we utilize a custom multimodal spectroscopy system to monitor for the very first time the rapid viscoelastic response of cells and subcellular structures to a short-duration electrical impulse. The cytomechanical response of three subcellular structures - cytoplasm, nucleoplasm, and nucleoli - were monitored, showing distinct mechanical changes despite an identical stimulus. Through this pioneering transformative study, we demonstrate the capability of Brillouin spectroscopy to measure rapid, real-time biomechanical changes within distinct subcellular compartments. Our results support the promising future of Brillouin spectroscopy within the broad scope of cellular biomechanics.

Keywords: Brillouin scattering; Fluorescence; Imaging; Microscopy; Raman scattering.


Conflict of interest statement

Competing interestsThe authors declare that they have no competing interests.

Figures

Fig. 1
Fig. 1
a (top) Conceptual illustration with examples of stimuli and cell behaviors linked to changes in cellular mechanics, (middle) cell responses, such as filament depolymerization, membrane disruption, and channel activation, and (bottom) examples of microscopic imaging modalities used in this report. Instrument capabilities and measurements include: b DIC imaging, indicators color-matched to c providing examples of locations used for Brillouin measurements taken from the subcellular compartments. c Average Brillouin frequency shift measurements from each of the three compartments. d Representative example of Brillouin and Raman spectral measurements from within a cell nucleolus. e Example of 3D mechanical map from CHO-K1 cell via z-stack of 2D Brillouin images. a Created with BioRender.com.
Fig. 2
Fig. 2
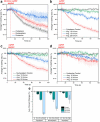
Time-resolved Brillouin frequency shift measurements of (a) All three target regions exposed to 20 kV/cm nsPEF, followed by (b) cytoplasm (c) nucleoplasm (inside the nuclear envelope) and (d) nucleolus, with each exposed to 10, 15 and 20 kV/cm. Values are displayed as a percentage of the starting value, as determined by a baseline average of the first 20 points in each series. e Bar chart depicting the average percent change by region and field intensity
Fig. 3
Fig. 3
YO-PRO-1 dye uptake following nsPEF exposure. (Top) Average relative change in fluorescence (∆F/Fo) taken from individual cells following nsPEF exposure of 1–10 kV/cm. (Bottom) Fluorescence time series example showing YO-PRO-1 dye uptake and a cathode-dependence directionality of dye influx. Yellow arrows with letters indicate the (A) anode and (C) cathode side of the electrode positions. Scale bar represents 5 μm
Fig. 4
Fig. 4
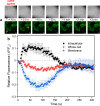
a DIC and fluorescence images from time series showing changes in actin distribution within cells exposed to a single 5 kV/cm nsPEF with yellow arrows pointing toward areas of membrane bound cortical actin and intracellular diffuse actin fluorescence. b Average change in relative fluorescence (∆F/Fo) measurements from cells within the field of view for the above time series images. Intracellular measurements were recorded with traces inside the cell membrane, whole cell measurements were recorded from traces outside the cell membrane, and membrane specific measurements were recorded from inside of the annulus of the previous two traces
Fig. 5
Fig. 5
Schematic diagram of VIPA-based dual micro-Brillouin-Raman spectroscopy system. Abbreviations and labels: SHG second harmonic generation of 532 nm beam, λ/2 half wave plate, M mirror, PBS polarizing beam splitter, DBS Raman dichroic beam splitter, I2 Iodine molecular absorption cell, CL cylindrical lens, and CCD spectral imaging camera

References

    1. Jonietz E. Mechanics: the forces of cancer. Nature. 2012;491:S56–S57. doi: 10.1038/491S56a. - DOI - PubMed
    1. Panciera T, et al. Reprogramming normal cells into tumour precursors requires ECM stiffness and oncogene-mediated changes of cell mechanical properties. Nat Mater. 2020;19:797–806. doi: 10.1038/s41563-020-0615-x. - DOI - PMC - PubMed
    1. Yuan S, Norgard RJ, Stanger BZ. Cellular plasticity in cancer. Cancer Discov. 2019;9:837–851. doi: 10.1158/2159-8290.CD-19-0015. - DOI - PMC - PubMed
    1. Cross SE, Jin YS, Rao J, Gimzewski JK. Nanomechanical analysis of cells from cancer patients. Nat Nanotech. 2007;2:780–783. doi: 10.1038/nnano.2007.388. - DOI - PubMed
    1. Han YL, et al. Cell swelling, softening and invasion in a three-dimensional breast cancer model. Nat Phys. 2020;16:101–108. doi: 10.1038/s41567-019-0680-8. - DOI - PMC - PubMed

LinkOut - more resources