. 2024 Apr 12;8(5):e0365.
doi: 10.1097/HC9.0000000000000365. eCollection 2024 May 1.

mARC1 in MASLD: Modulation of lipid accumulation in human hepatocytes and adipocytes

Affiliations

mARC1 in MASLD: Modulation of lipid accumulation in human hepatocytes and adipocytes

Amanda K Jones et al. Hepatol Commun. .

Abstract

Background: Mutations in the gene MTARC1 (mitochondrial amidoxime-reducing component 1) protect carriers from metabolic dysfunction-associated steatohepatitis (MASH) and cirrhosis. MTARC1 encodes the mARC1 enzyme, which is localized to the mitochondria and has no known MASH-relevant molecular function. Our studies aimed to expand on the published human genetic mARC1 data and to observe the molecular effects of mARC1 modulation in preclinical MASH models.

Methods and results: We identified a novel human structural variant deletion in MTARC1, which is associated with various biomarkers of liver health, including alanine aminotransferase levels. Phenome-wide Mendelian Randomization analyses additionally identified novel putatively causal associations between MTARC1 expression, and esophageal varices and cardiorespiratory traits. We observed that protective MTARC1 variants decreased protein accumulation in in vitro overexpression systems and used genetic tools to study mARC1 depletion in relevant human and mouse systems. Hepatocyte mARC1 knockdown in murine MASH models reduced body weight, liver steatosis, oxidative stress, cell death, and fibrogenesis markers. mARC1 siRNA treatment and overexpression modulated lipid accumulation and cell death consistently in primary human hepatocytes, hepatocyte cell lines, and primary human adipocytes. mARC1 depletion affected the accumulation of distinct lipid species and the expression of inflammatory and mitochondrial pathway genes/proteins in both in vitro and in vivo models.

Conclusions: Depleting hepatocyte mARC1 improved metabolic dysfunction-associated steatotic liver disease-related outcomes. Given the functional role of mARC1 in human adipocyte lipid accumulation, systemic targeting of mARC1 should be considered when designing mARC1 therapies. Our data point to plasma lipid biomarkers predictive of mARC1 abundance, such as Ceramide 22:1. We propose future areas of study to describe the precise molecular function of mARC1, including lipid trafficking and subcellular location within or around the mitochondria and endoplasmic reticulum.


Conflict of interest statement

All authors are presently employed by or have received research funding from Boehringer Ingelheim. Dmitriy Drichel consults for Boehringer Ingelheim and Merck. Martin Giera owns stock in Gilead and GlaxoSmithKline.

Figures

None
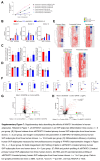
Graphical abstract
FIGURE 1
FIGURE 1
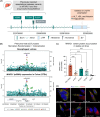
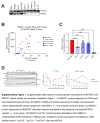
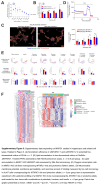
Genetic variants in MTARC1 are associated with liver enzyme levels and susceptibility to and progression of MASLD-related and cirrhosis-related human traits—likely by decreasing mARC1 protein accumulation. (A) Schema of previously reported associations between variants in MTARC1 (including the novel SV-deletion identified in this study) and liver enzymes and liver disease–related outcomes. (B) Phenome-wide Mendelian randomization analyses followed by colocalization analyses identified putatively causal links between mARC1 expression levels and susceptibility to develop esophageal varices (IEU OpenGWAS study ID: finn-b-I9_VARICVEOES). (C) mARC1 protein expression in U-138 MG-derived stable cell clones transfected with vectors encoding variants of MTARC1. Risk allele: A allele of rs2642438 (coding for missense: p.T165A), Protective alleles: G allele of rs2642438, p.M187K, and p.R200*; Synthetic: p.C273A. Western blot quantitation is normalized to mRNA expression. Data are presented as means±SEM, n=6–8 clones/variant. (D) Immunofluorescence imaging of human U-138 MG cells expressing mARC1 variant proteins (green), TOMM20 (mitochondria—red), nuclei (blue) labeled. Scale bars, 10 μm. *p≤0.05, ***p≤0.001, one-way ANOVA. Abbreviations: ALT, alanine aminotransferase; eQTL, expression quantitative trait locus; GWAS, genome-wide association study; MASLD, metabolic dysfunction–associated steatotic liver disease; MTARC1, mitochondrial amidoxime–reducing component 1; SV, structural variant.
FIGURE 2
FIGURE 2
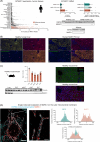
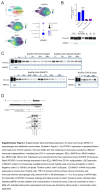
mARC1 expression profile differs in human and mouse tissues and mARC1 protein localizes to the outer mitochondrial membrane. (A) Human mARC1 expression from GTEx database (mRNA, TPM) and by qPCR and western blots in human liver and adipose tissue. (B) Immunofluorescence imaging of human healthy and MASH (fibrosis score 3) livers (nuclei=blue, carbamoyl phosphate synthetase [CPS1] hepatocytes=yellow, mARC1=red, CD68=green). Pink arrowheads highlight CD68/mARC1 coexpression. Scale bars, 50 μm. (C) mARC1 RNA and protein expression in mouse liver, inguinal (iWAT), gonadal (gWAT), and perirenal (rWAT) white adipose tissue and brown adipose tissue (BAT). Multiplexed Mtarc1 in situ hybridization (red) and immunofluorescence colocalization with ASGR1 (hepatocytes/green) or F4/80 (macrophages/green) and nuclei (blue) in mouse liver. Scale bars, 50 μm. (D) Single-molecule localization of mARC1 (red) and heat shock protein 60 (HSP60=mitochondrial matrix/blue) in cultured human cells. Scale bars, 10 μm and 1 μm (inset). n=20 human liver and 8 human adipose samples in western blots and qPCR. Data in bar graphs are presented as mean±SEM with individual data points represented. Abbreviations: CD68, cluster of differentiation 68; GAPDH, glyceraldehyde-3-phosphate dehydrogenase; GTEx, genotype-tissue expression; mARC1, mitochondrial amidoxime–reducing component 1; MASH, metabolic dysfunction–associated steatohepatitis; qPCR, quantitative reverse transcription polymerase chain reaction; TPM, transcripts per million.
FIGURE 3
FIGURE 3
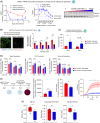
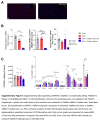
mARC1 expression modulation by genetic tools affects steatosis, oxidative stress, cell death, and lipid profile in human in vitro hepatocyte models. (A) Time course and dose-response of mARC1 RNA and protein in PHH spheroids treated with GalNAc-siMTARC1. n=2 wells. (B) Lipid accumulation in the 2-dimensional culture of GalNAc-siMTARC1.1-treated PHHs assessed by Nile Red fluorescence assay, nuclei (blue), neutral lipids (green), and phospholipids (yellow). Scale bars, 100 μm. n=6–8/group. (C) Ratio of reduced to oxidized glutathione in PHH spheroids treated with GalNAc-siMTARC1.1 at days 7 and 9 after treatment. n=6/group. (D) Oxygen consumption rate parameters measured in mARC1 KO cell lines overexpressing mARC1 risk and protective (p.R200*) alleles. N=24/well/group. (E) Quantification of mitochondrial membrane potential, cell permeability, and annexin V in palmitate, fructose, and glucose-treated mARC1 overexpressing cells measured by live-cell microscopy. n=3/group. (F) Quantification of lipid species in mARC1 OE mARC1 KO cell lines. n=5/group. Data are presented as mean±SEM. *p≤0.05, **p≤0.01, ***p≤0.001, one-way ANOVA or t test. Abbreviations: GAPDH, glyceraldehyde-3-phosphate dehydrogenase; KO, knockout; mARC1, mitochondrial amidoxime–reducing component 1; OE, overexpression; PHH, primary human hepatocytes; WT, Wild-type.
FIGURE 4
FIGURE 4
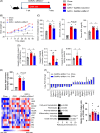
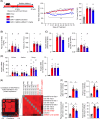
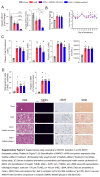
mARC1 depletion by GalNAc-siMtarc1 (3 mg/kg) reduces hepatic steatosis and oxidative stress in a lipotoxicity setting. (A) Experimental design (n=6–8 mice/group). (B) Body weight curve. (C) Serum cholesterol biomarkers. (C) Hepatic mitochondrial DNA content and oxidative stress markers. (E) Quantification of total hepatic lipid content and specific lipid classes. (F) DEGs by GalNAc-siMtarc1, pathway enrichment of DEG by GalNAc-siMtarc1 versus GAN, hepatic flow cytometry analysis. Data are presented as mean±SEM. Data sets with 3 groups: one-way ANOVA (*p<0.05). Data sets with 4 groups: t test Chow versus GAN (*p<0.05), then one-way ANOVA with Dunnet’s to compare GalNAc-treatment to GAN (#p<0.05). Longitudinal data were analyzed by two-way ANOVA with repeated measures (*p<0.05 GAN vs. chow, #p<0.05 GalNAc-siMtarc1 vs. GAN). Abbreviations: CYTB, Cytochrome B; DEG, differentially expressed gene; GAN, Gubra-amylin-NASH diet; GAPDH, glyceraldehyde-3-phosphate dehydrogenase; mARC1, mitochondrial amidoxime–reducing component 1; PGF2α, prostaglandin F2alpha; TBARS, thiobarbituric acid reactive substances.
FIGURE 5
FIGURE 5
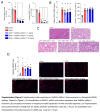
mARC1 depletion by GalNAc-siMtarc1 reduces steatosis, cell death, and fibrogenesis markers in a therapeutic MASH setting. (A) Experimental design (n=8–16 mice/group), relative body weight change, and body fat mass after 12 weeks GalNAc-siMtarc1. (B) Circulating biomarkers of hepatocyte health. (C) Quantification of hepatic steatosis and hepatic oxidative stress. (D) Hepatic fibrogenesis mRNA and fibrosis area. Circulating fibrogenesis biomarker, hepatic mRNA, and fibrosis area. (E) Left: Profiling of global plasma lipidomics correlation with Mtarc1 hepatic protein expression; Right: Zoomed-in cluster representing greatest Mtarc1 protein correlation to distinct lipids. (F) Selected plasma-lipids correlating with Mtarc1 hepatic protein expression. Data are presented as mean±SEM. Data sets with 3 groups: one-way ANOVA (*p<0.05). Data sets with 4 groups: t test Chow versus GAN (*p<0.05), then one-way ANOVA with Dunnet’s compared GalNAc-treatment to GAN (#p<0.05). Longitudinal data were analyzed by two-way ANOVA with repeated measures (#p<0.05 GalNAc-siMtarc1 vs. GAN). Abbreviations: 4-HNE, 4-hydroxy-nonenal; ALT, alanine aminotransferase; BW, body weight; GAN, Gubra-amylin-NASH diet; mARC1, mitochondrial amidoxime–reducing component 1; MASH, metabolic dysfunction–associated steatohepatitis; SRM, Sirius red morphometry.
FIGURE 6
FIGURE 6
Dose-responsive effects of GalNAc-siMtarc1 on lipidomic and proteomic profile in a therapeutic MASH setting. (A) Experimental design (n=8–16 mice/group). (B) Serum cholesterol and fibrogenesis biomarkers. (C) Quantification of hepatic steatosis. (D) Plasma abundance of targeted lipid species. (E) Correlation of plasma Ceramide d18:1/22:1 with hepatic mARC1 protein. (F) Correlation of hepatic proteins and mARC1 expression. Data are presented as mean±SEM. Data were analyzed by t test to compare control and diet conditions (*p<0.05), then a one-way ANOVA with Dunnett’s to compare GalNAc-treated groups to diet (#p<0.05). Correlations were generated by linear regression. Abbreviations: ACOT12, acetyl-coenzyme A thioesterase 12; ASCL4, long-chain-fatty-acid-CoA ligase 4; GAN, Gubra-amylin-NASH diet; mTARC1, mitochondrial amidoxime–reducing component 1; MASH, metabolic dysfunction–associated steatohepatitis; PIIINP, procollagen III N-terminal peptide; SLC25a17, solute carrier family 25 member 17; TIMP1, metallopeptidase inhibitor 1.
FIGURE 7
FIGURE 7
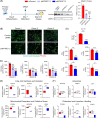
siMTARC1 treatment reduces triglyceride accumulation and cell death in human primary SVF-adipocytes. (A) Study plan for siMTARC1 treatment in primary human SVF-adipocytes and mARC1 knockdown percentage measured by western blot. n=2 wells. (B) Immunofluorescence imaging of nuclei (blue), lipid droplets (green), and PPARG (red). (C) Biochemical quantitation of TG abundance in siMTARC1.2-treated primary human SVF-adipocytes from 3 human donors. Scale bar=100 μm. n=5 wells/group. (D) LC/MS quantitation of cholesteryl ester 16:1, and lipid classes in siMTARC1.2-treated primary human SVF-adipocytes from one human donor. n=5 samples per group. (E) RNA and (F) secreted protein abundance of adipokines in siMTARC1-treated primary human SVF-adipocytes from 3 human donors. n=3 for RNA, n=5 for protein. Data in bar graphs presented as mean±SEM. *p≤0.05, **p≤0.01, ***p≤0.001, one-way ANOVA or t test. Abbreviations: LC/MS, Liquid chromatography/Mass spectrometry; mTARC1, mitochondrial amidoxime–reducing component 1; PPARG, Peroxisome proliferator activated receptor gamma; SVF, stromal vascular fraction of adipose tissue.
FIGURE 8
FIGURE 8
Schematic summary of molecular profiling observations in mARC1 preclinical models and relationship to known MASH-relevant metabolic pathways. Specific factors modulated by mARC1 are in black font. Abbreviations: ACOT12, acetyl-coenzyme A thioesterase 12; mARC1, mitochondrial amidoxime–reducing component 1; MASH, metabolic dysfunction–associated steatohepatitis; TMEM245, transmembrane protein 245.
None
None
None
None
None
None
None

References

    1. Rinella ME, Lazarus JV, Ratziu V, Francque SM, Sanyal AJ, Kanwal F, et al. . A multi-society Delphi consensus statement on new fatty liver disease nomenclature. J Hepatol. 2023;78:1966–1986. - PubMed
    1. Sanyal AJ, Harrison SA, Ratziu V, Abdelmalek MF, Diehl AM, Caldwell S, et al. . The natural history of advanced fibrosis due to nonalcoholic steatohepatitis: Data from the simtuzumab trials. Hepatology. 2019;70:1913–1927. - PubMed
    1. Younossi ZM, Wong G, Anstee QM, Henry L. The global burden of liver disease. Clin Gastroenterol Hepatol. 2023;21:1978–1991. - PubMed
    1. Alkhouri N, Gornicka A, Berk MP, Thapaliya S, Dixon LJ, Kashyap S, et al. . Adipocyte apoptosis, a link between obesity, insulin resistance, and hepatic steatosis. J Biol Chem. 2010;285:3428–3438. - PMC - PubMed
    1. Plessis J du, Pelt J van, Korf H, Mathieu C, Schueren B van der, Lannoo M, et al. . Association of adipose tissue inflammation with histologic severity of nonalcoholic fatty liver disease. Gastroenterology. 2015;149:635–648.e14. - PubMed

Publication types