. 2024 Apr;132(4):47007.
doi: 10.1289/EHP14132. Epub 2024 Apr 15.

Multiomics Analysis of PCB126's Effect on a Mouse Chronic-Binge Alcohol Feeding Model

Affiliations

Multiomics Analysis of PCB126's Effect on a Mouse Chronic-Binge Alcohol Feeding Model

Tyler C Gripshover et al. Environ Health Perspect. 2024 Apr.

Abstract

Background: Environmental pollutants, including polychlorinated biphenyls (PCBs) have been implicated in the pathogenesis of liver disease. Our group recently demonstrated that PCB126 promoted steatosis, hepatomegaly, and modulated intermediary metabolism in a rodent model of alcohol-associated liver disease (ALD).

Objective: To better understand how PCB126 promoted ALD in our previous model, the current study adopts multiple omics approaches to elucidate potential mechanistic hypotheses.

Methods: Briefly, male C57BL/6J mice were exposed to 0.2mg/kg polychlorinated biphenyl (PCB) 126 or corn oil vehicle prior to ethanol (EtOH) or control diet feeding in the chronic-binge alcohol feeding model. Liver tissues were collected and prepared for mRNA sequencing, phosphoproteomics, and inductively coupled plasma mass spectrometry for metals quantification.

Results: Principal component analysis showed that PCB126 uniquely modified the transcriptome in EtOH-fed mice. EtOH feeding alone resulted in >4,000 differentially expressed genes (DEGs), and PCB126 exposure resulted in more DEGs in the EtOH-fed group (907 DEGs) in comparison with the pair-fed group (503 DEGs). Top 20 significant gene ontology (GO) biological processes included "peptidyl tyrosine modifications," whereas top 25 significantly decreasing GO molecular functions included "metal/ion/zinc binding." Quantitative, label-free phosphoproteomics and western blot analysis revealed no major significant PCB126 effects on total phosphorylated tyrosine residues in EtOH-fed mice. Quantified hepatic essential metal levels were primarily significantly lower in EtOH-fed mice. PCB126-exposed mice had significantly lower magnesium, cobalt, and zinc levels in EtOH-fed mice.

Discussion: Previous work has demonstrated that PCB126 is a modifying factor in metabolic dysfunction-associated steatotic liver disease (MASLD), and our current work suggests that pollutants also modify ALD. PCB126 may, in part, be contributing to the malnutrition aspect of ALD, where metal deficiency is known to contribute and worsen prognosis. https://doi.org/10.1289/EHP14132.


Figures

Figure 1 is a Principal component analysis plot titled Scores plot, plotting principal component 2 (26.5 percent), ranging from negative 500 to 500 in increments of 500 (y-axis) across principal component 1 (27 percent), ranging from negative 400 to 200 in increments of 200 (x-axis) for ethanol-fed P C B 126, ethanol-fed vehicle, pair-fed P C B 126, pair-fed vehicle.
Figure 1.
PCA for all samples (n=6; n=24). PCA plot was generated on MetaboAnalyst based on FPKM values, filtered by interquartile range, and normalized based on group median. Individual samples are identified by diet_exposure_number, where diet is either PF or EF, and exposure is either vehicle (VEH) or PCB126 (PCB). Note: EF, EtOH-fed; FPKM, fragments per kilobase per million mapped fragments; PC, principal component; PCA, principal component analysis; PF, pair-fed.
Figure 2 is a horizontal bar graph, plotting leukocyte proliferation, response to virus, regulation of inflammatory response, regulation of leukocyte migration, defense response to virus, regulation of mononuclear cell proliferation, regulation of lymphocyte proliferation, regulation of leukocyte proliferation, antigen processing and presentation of peptide or polysaccharide antigen via M H C class 2, antigen processing and presentation of exogenous peptide antigen, reactive oxygen species metabolic process, antigen processing and presentation of peptide antigen via M H C class 2, leukocyte cell-cell adhesion, regulation of endocytosis, peptidyl-tyrosine phosphorylation, regulation of peptidyl-tyrosine phosphorylation, leukocyte migration, positive regulation of peptidyl-tyrosine phosphorylation, xenobiotic metabolic process, peptidyl-tyrosine modification (y-axis) across DESeq2 differential expression analysis, ranging from 0 to 40 in increments of 10 (x-axis). A scale depicts the adjusted p-value is divided into five parts, namely, 2 e to 09, 3 e to 09, 4 e to 09, 5 e to 09, and 6 e to 09.
Figure 2.
Top 20 significantly enriched GO biological processes of the EF(Veh. vs. PCB126) comparison (n=6 vs. 6), sorted by lowest adjusted p-value (p.adjust). GO biological processes were determined by R package clusterProfiler, where DESeq2 differential expression analysis results were implemented for this pairwise comparison. Please refer to the Supplemental Excel file for summary data for this figure. Note: EF, EtOH-fed; GO, gene ontology; p.adjust, adjusted p-value.
Figure 3 is a horizontal bar graph, plotting R N A polymerase 2 specific D N A binding transcription factor binding, transaction coregulator activity, D N A binding transcription factor binding, chromatin binding, transcription factor binding, zinc ion binding, transition metal ion binding, adenyl nucleotide binding, R N A binding, purine nucleotide binding, nucleotide binding, nucleoside phosphate binding, enzyme binding, transferase activity, anion binding, small molecule binding, nucleic acid binding, metal ion binding, cation binding, ion binding, heterocyclic compound binding, catalytic activity, organic cyclic compound binding, protein binding, and binding (y-axis) across decreasing signal, ranging from 0 to 6000 in increments of 2000 (x-axis) for adjusted p-value, including 5.070 e to 130, 1.165 e to 17, 2.330 e to 17, 3.495 e to 17, 4.660 e to 17.
Figure 3.
Top 25 significantly enriched GO molecular functions of the EF(Veh. vs. PCB126) comparison (n=6 vs. 6), sorted by lowest adjusted p-value (p.adjust) and decreasing signal. Enriched GO molecular functions were determined on the MetaCore platform for the EF(Veh. vs. PCB126) dataset for a false discovery rate set at 0.05. Please refer to the Supplemental Excel file for summary data for this figure. Note: EF, EtOH-fed; GO, gene ontology; p.adjust, adjusted p-value.
Figure 4A is a Principal component analysis plot titled Scores plot, plotting principal component 2 (3.9 percent), ranging from negative 200 to 400 in increments of 200 (y-axis) across principal component 1 (88.1 percent), ranging from negative 1500 to 1000 in increments of 500 (x-axis) for ethanol-fed P C B 126, ethanol-fed vehicle, pair-fed P C B 126, pair-fed vehicle. Figure 4B is a graph, plotting count of P-Tyrosine peptides, ranging from 35 to 55 in increments of 5 (y-axis) across pair-fed and ethanol-fed (x-axis) for vehicle and P C B 126.
Figure 4.
Characterization of phosphoproteome dataset for all samples, excluding outlier EF_PCB3 (n=23). (A) PCA of each group where SD areas encircle each sample. PCA plot was generated on MetaboAnalyst where phospho-peptides were quantile normalized and then removed if >40% of the values were missing. Missing values were replaced by the limit of detection (1/5 of minimum positive value of each variable). (B) Total count of phosphorylated tyrosine for each sample. All peptides containing a phosphorylated tyrosine residue were counted if the peptide area was >0. Values are represented as mean±SD with an alpha level set to 0.05. Significance was determined by two-way ANOVA and Tukey’s post hoc test, where post hoc p-values are provided above the figure. Please refer to the Supplemental Excel file for summary data for this figure. Note: ANOVA, analysis of variance; EF, EtOH-fed; PC, principal component; PCA, principal component analysis; PF, pair-fed; SD, standard deviation; Veh, vehicle.
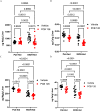
Figures 5A to 5D are graphs, plotting microgram sodium per gram liver, ranging from 0 to 2000 in increments of 500; microgram cobalt per gram liver, ranging from 0.00 to 0.06 in increments of 0.02; microgram magnesium per gram liver, ranging from 0 to 400 in increments of 100; microgram zinc per gram liver, ranging from 0 to 40 in increments of 10 (y-axis) across pair-fed and ethanol-fed (x-axis) for vehicle and P C B 126.
Figure 5.
ICP-MS analysis of four essential micronutrient metals: (A) Na; (B) Co; (C) Mg; and (D) Zn. Values are represented as mean±SD with an alpha level set to 0.05 (n=15; n=60). Significance was determined by two-way ANOVA and Tukey’s post hoc test, where post hoc p-values are provided above each graph. Please refer to the Supplemental Excel file for summary data for this figure. Note: ANOVA, analysis of variance; Co, cobalt; ICP-MS, inductively coupled plasma mass spectrometry; Mg, magnesium; Na, sodium; SD, standard deviation; Zn, zinc.

References

    1. Axley PD, Richardson CT, Singal AK. 2019. Epidemiology of alcohol consumption and societal burden of alcoholism and alcoholic liver disease. Clin Liver Dis 23(1):39–50, PMID: , 10.1016/j.cld.2018.09.011. - DOI - PubMed
    1. Witkiewitz K, Litten RZ, Leggio L. 2019. Advances in the science and treatment of alcohol use disorder. Sci Adv 5(9):eaax4043, PMID: , 10.1126/sciadv.aax4043. - DOI - PMC - PubMed
    1. Cholankeril G, Ahmed A. 2018. Alcoholic liver disease replaces hepatitis C virus infection as the leading indication for liver transplantation in the United States. Clin Gastroenterol Hepatol 16(8):1356–1358, PMID: , 10.1016/j.cgh.2017.11.045. - DOI - PMC - PubMed
    1. Hirode G, Saab S, Wong RJ. 2020. Trends in the burden of chronic liver disease among hospitalized US adults. JAMA Netw Open 3(4):e201997, PMID: , 10.1001/jamanetworkopen.2020.1997. - DOI - PMC - PubMed
    1. Julien J, Ayer T, Bethea ED, Tapper EB, Chhatwal J. 2020. Projected prevalence and mortality associated with alcohol-related liver disease in the USA, 2019-40: a modelling study. Lancet Public Health 5(6):e316–e323, PMID: , 10.1016/S2468-2667(20)30062-1. - DOI - PubMed