

The airborne contagiousness of respiratory viruses: A comparative analysis and implications for mitigation
- PMID: 38620948
- PMCID: PMC8378671
- DOI: 10.1016/j.gsf.2021.101285
The airborne contagiousness of respiratory viruses: A comparative analysis and implications for mitigation
Abstract
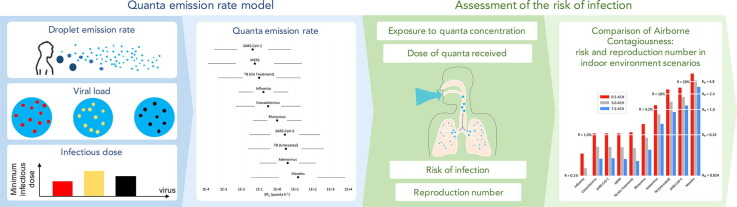
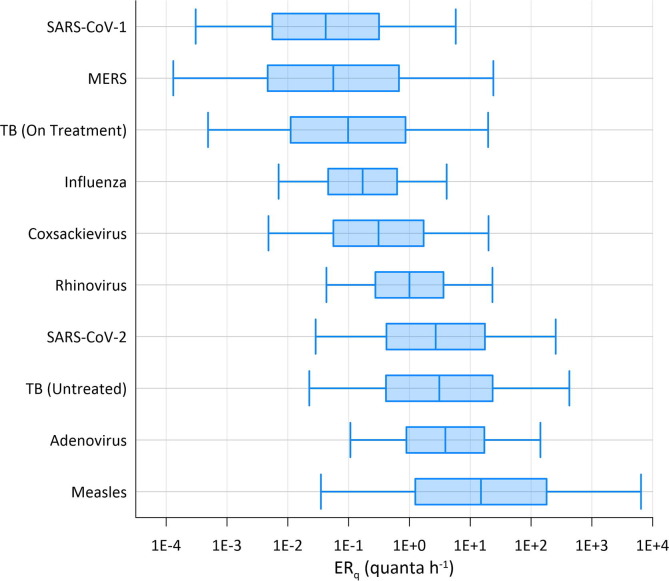
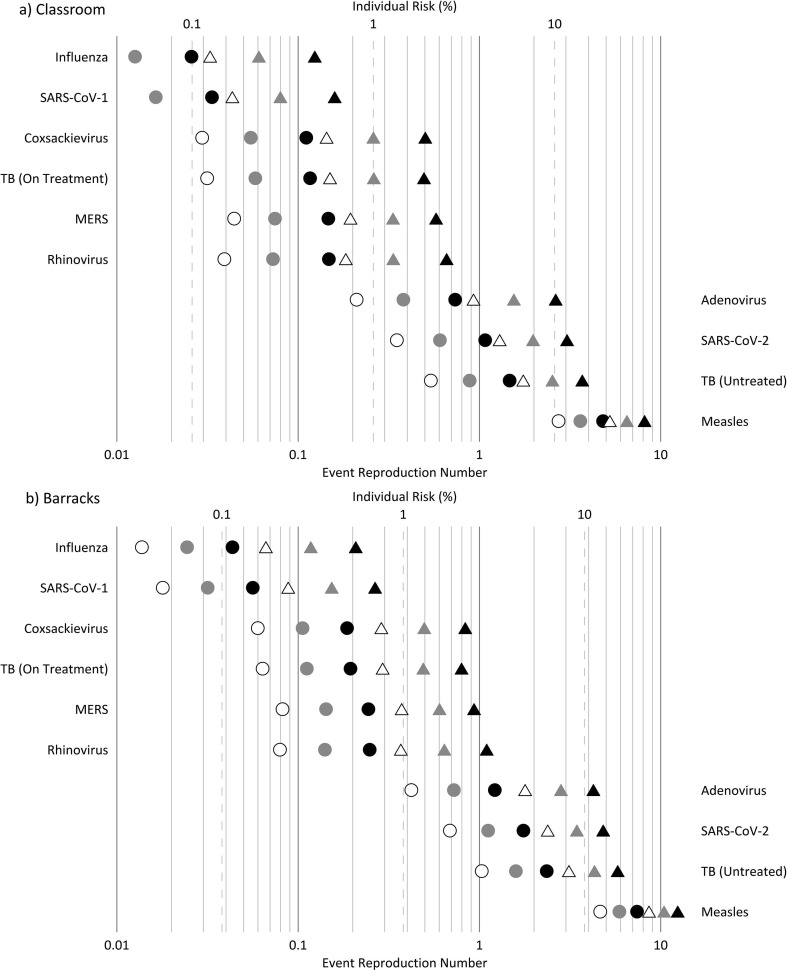
The infectious emission rate is a fundamental input parameter for airborne transmission risk assessment, but data are limited due to reliance on estimates from chance superspreading events. This study assesses the strength of a predictive estimation approach developed by the authors for SARS-CoV-2 and uses novel estimates to compare the contagiousness of respiratory pathogens. We applied the approach to SARS-CoV-1, SARS-CoV-2, MERS, measles virus, adenovirus, rhinovirus, coxsackievirus, seasonal influenza virus and Mycobacterium tuberculosis (TB) and compared quanta emission rate (ERq) estimates to literature values. We calculated infection risk in a prototypical classroom and barracks to assess the relative ability of ventilation to mitigate airborne transmission. Our median standing and speaking ERq estimate for SARS-CoV-2 (2.7 quanta h-1) is similar to active, untreated TB (3.1 quanta h-1), higher than seasonal influenza (0.17 quanta h-1), and lower than measles virus (15 quanta h-1). We calculated event reproduction numbers above 1 for SARS-CoV-2, measles virus, and untreated TB in both the classroom and barracks for an activity level of standing and speaking at low, medium and high ventilation rates of 2.3, 6.6 and 14 L per second per person (L s-1 p-1), respectively. Our predictive ERq estimates are consistent with the range of values reported over decades of research. In congregate settings, current ventilation standards are unlikely to control the spread of viruses with upper quartile ERq values above 10 quanta h-1, such as SARS-CoV-2, indicating the need for additional control measures.
Keywords: Influenza; Measles; Quanta emission rate; SARS-CoV-2 (COVID-19) airborne transmission; Ventilation.
© 2021 China University of Geosciences (Beijing) and Peking University. Production and hosting by Elsevier B.V.
Conflict of interest statement
The authors declare that they have no known competing financial interests or personal relationships that could have appeared to influence the work reported in this paper.
Figures
References
-
- Adams, W.C., 1993. Measurement of Breathing Rate and Volume in Routinely Performed Daily Activities. Final Report. Human Performance Laboratory, Physical Education Department, University of California, Davis. Prepared for the California Air Resources Board, Contract No. A033-205, April, 1993.
-
- American Society of Heating, Refrigerating, and Air-Conditioning Engineers, Inc. (ASHRAE), 2019. ANSI/ASHRAE Standard 62.1-2019: Ventilation for acceptable indoor air quality. Atlanta, GA, 92.
-
- Atkinson, J., Chartier, Y., Pessoa-Silva, C.L., Jensen, P., Li, Y., Seto, W.H., 2009. Natural Ventilation for Infection Control in Health-Care Settings, first ed. Geneva: World Health Organization, Switzerland, 133 pp. https://www.ncbi.nlm.nih.gov/books/NBK143284/. - PubMed
-
- Balachandar S., Zaleski S., Soldati A., Ahmadi G., Bourouiba L. Host-to-host airborne transmission as a multiphase flow problem for science-based social distance guidelines. Int. J. Multiph. Flow. 2020;132
LinkOut - more resources
Full Text Sources
Miscellaneous