. 2024 Apr 23;121(17):e2318420121.
doi: 10.1073/pnas.2318420121. Epub 2024 Apr 15.

Iron regulates the quiescence of naive CD4 T cells by controlling mitochondria and cellular metabolism

Affiliations

Iron regulates the quiescence of naive CD4 T cells by controlling mitochondria and cellular metabolism

Ajay Kumar et al. Proc Natl Acad Sci U S A. .

Abstract

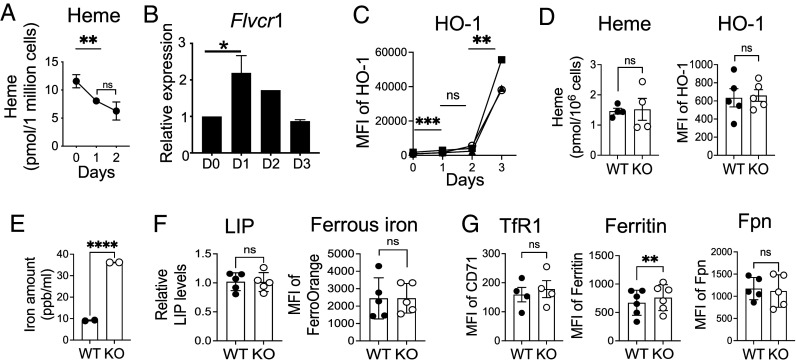
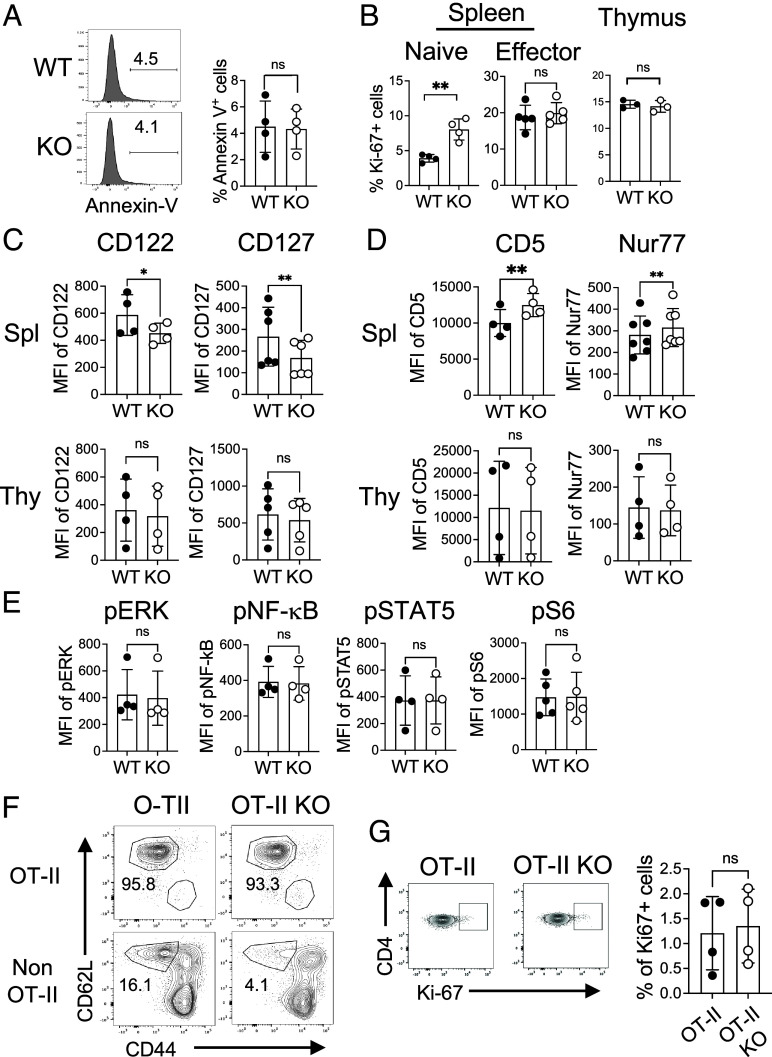
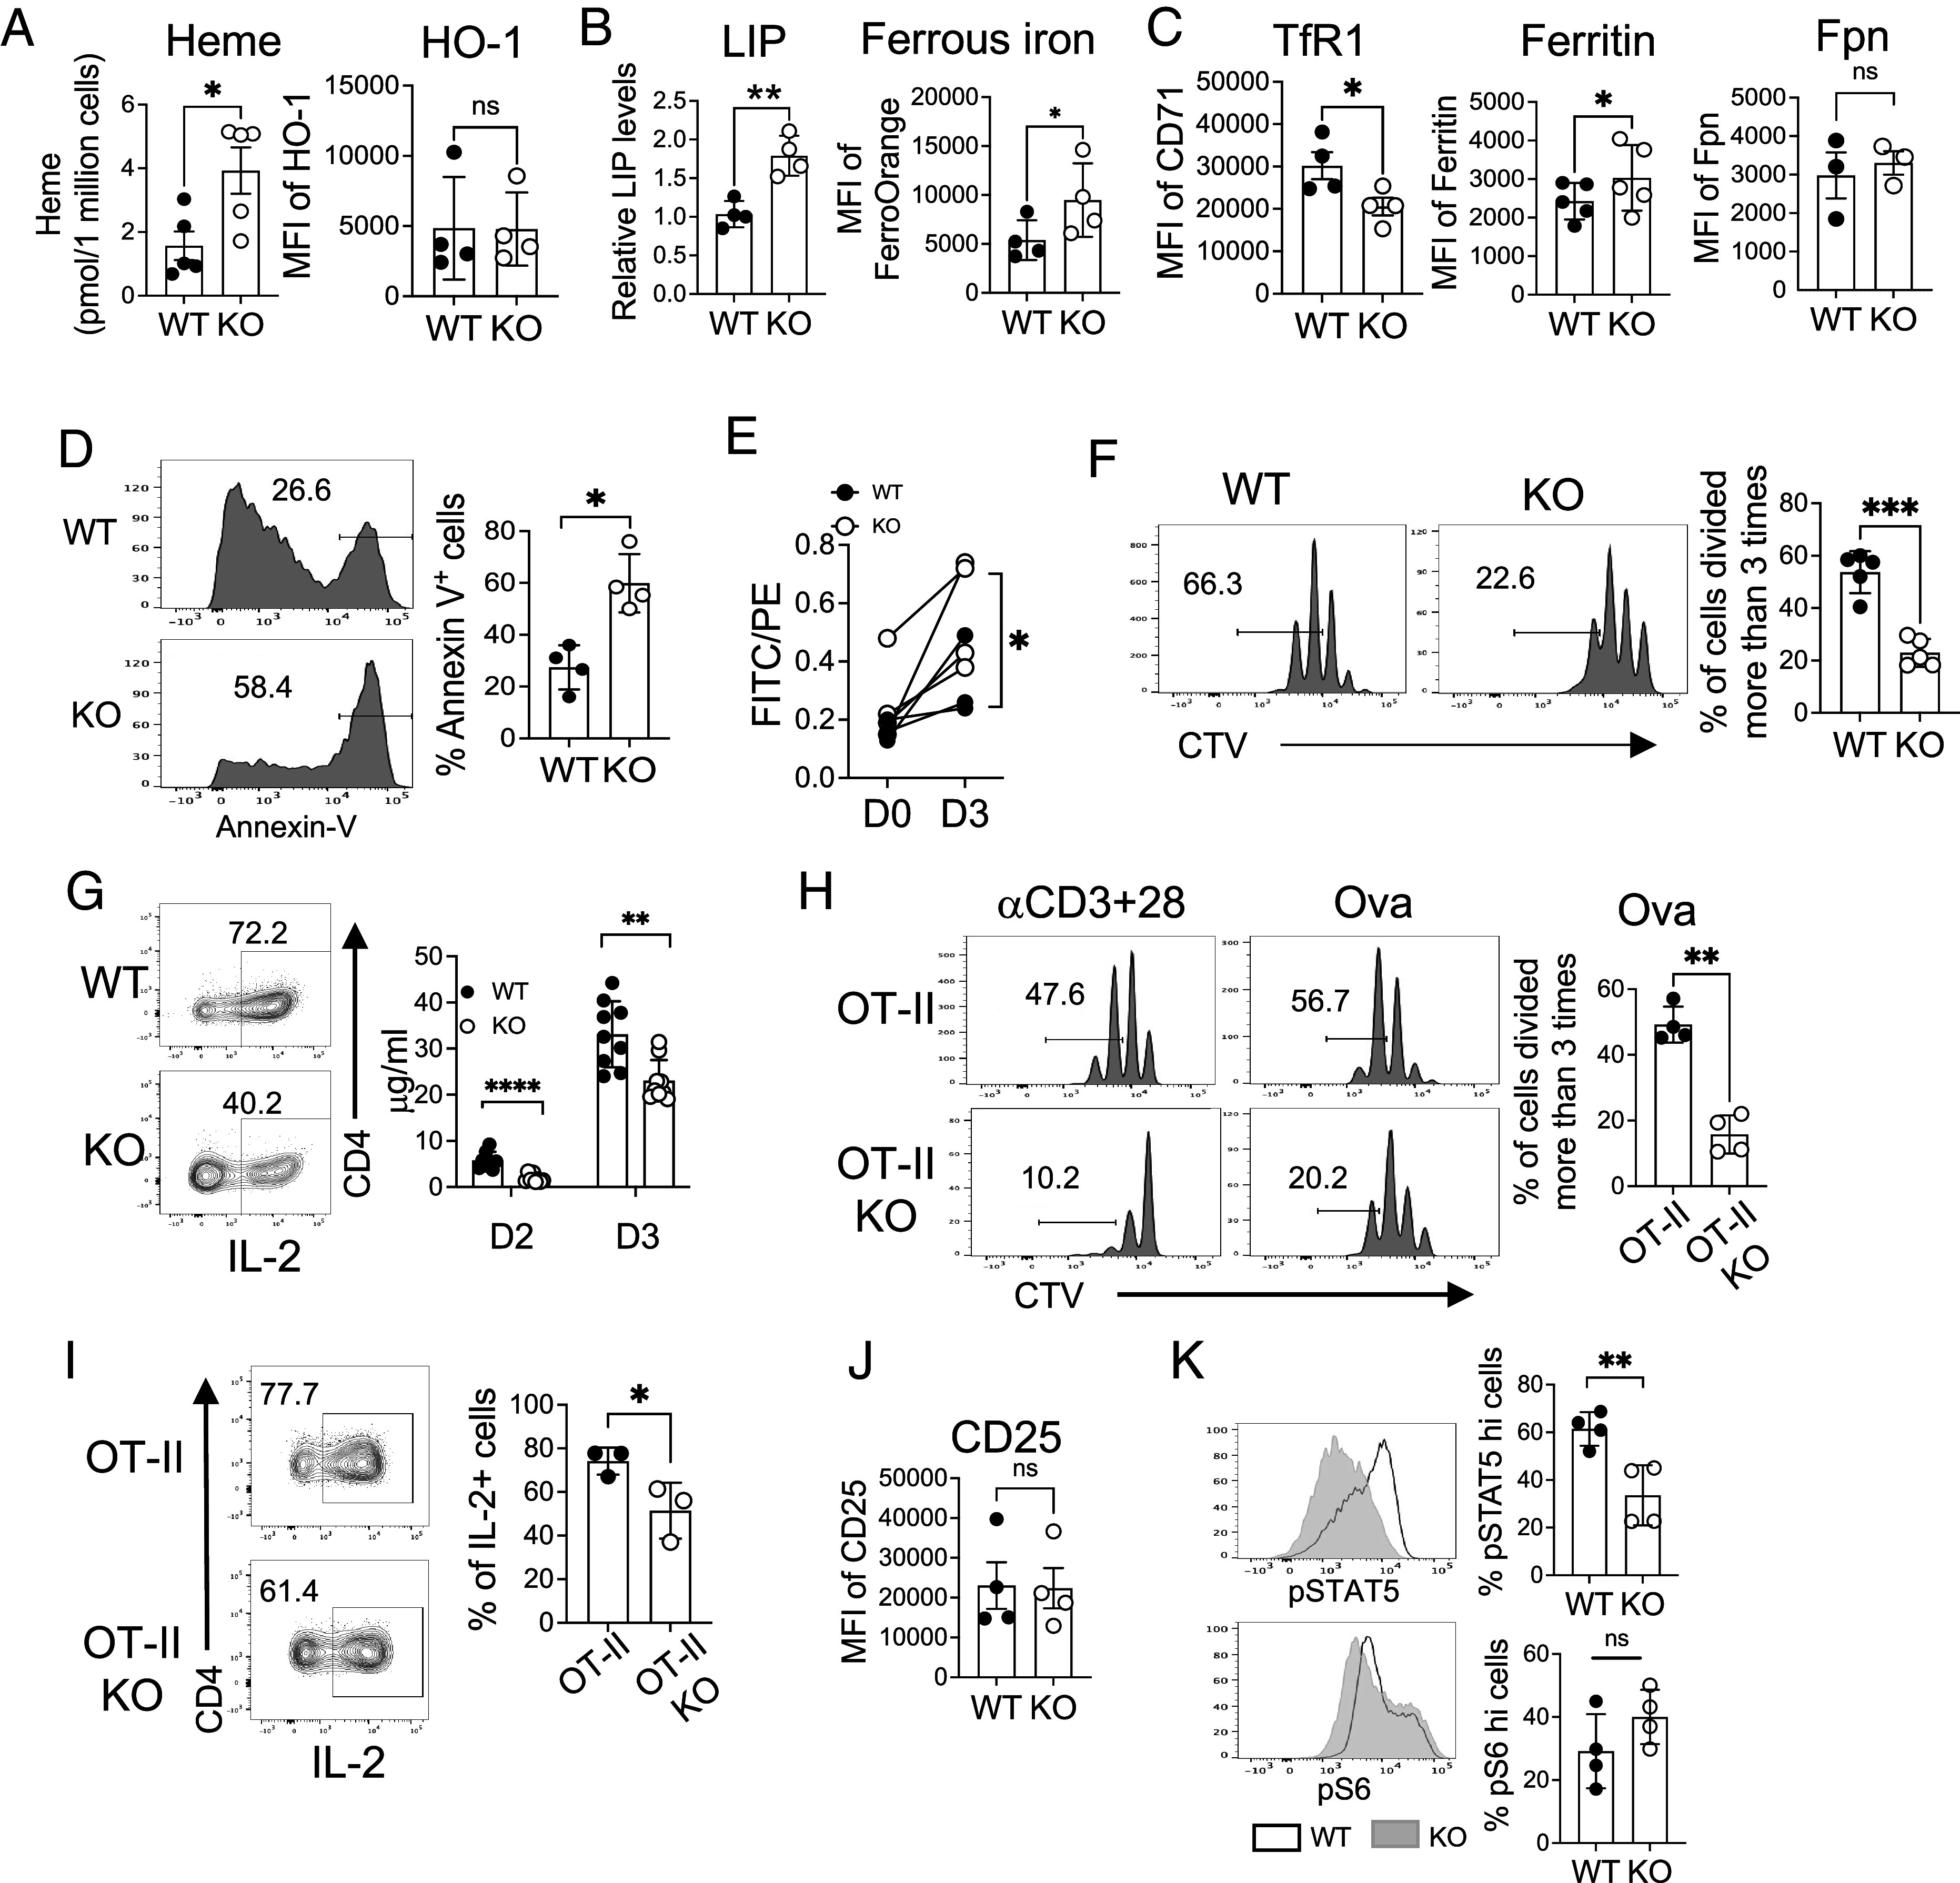
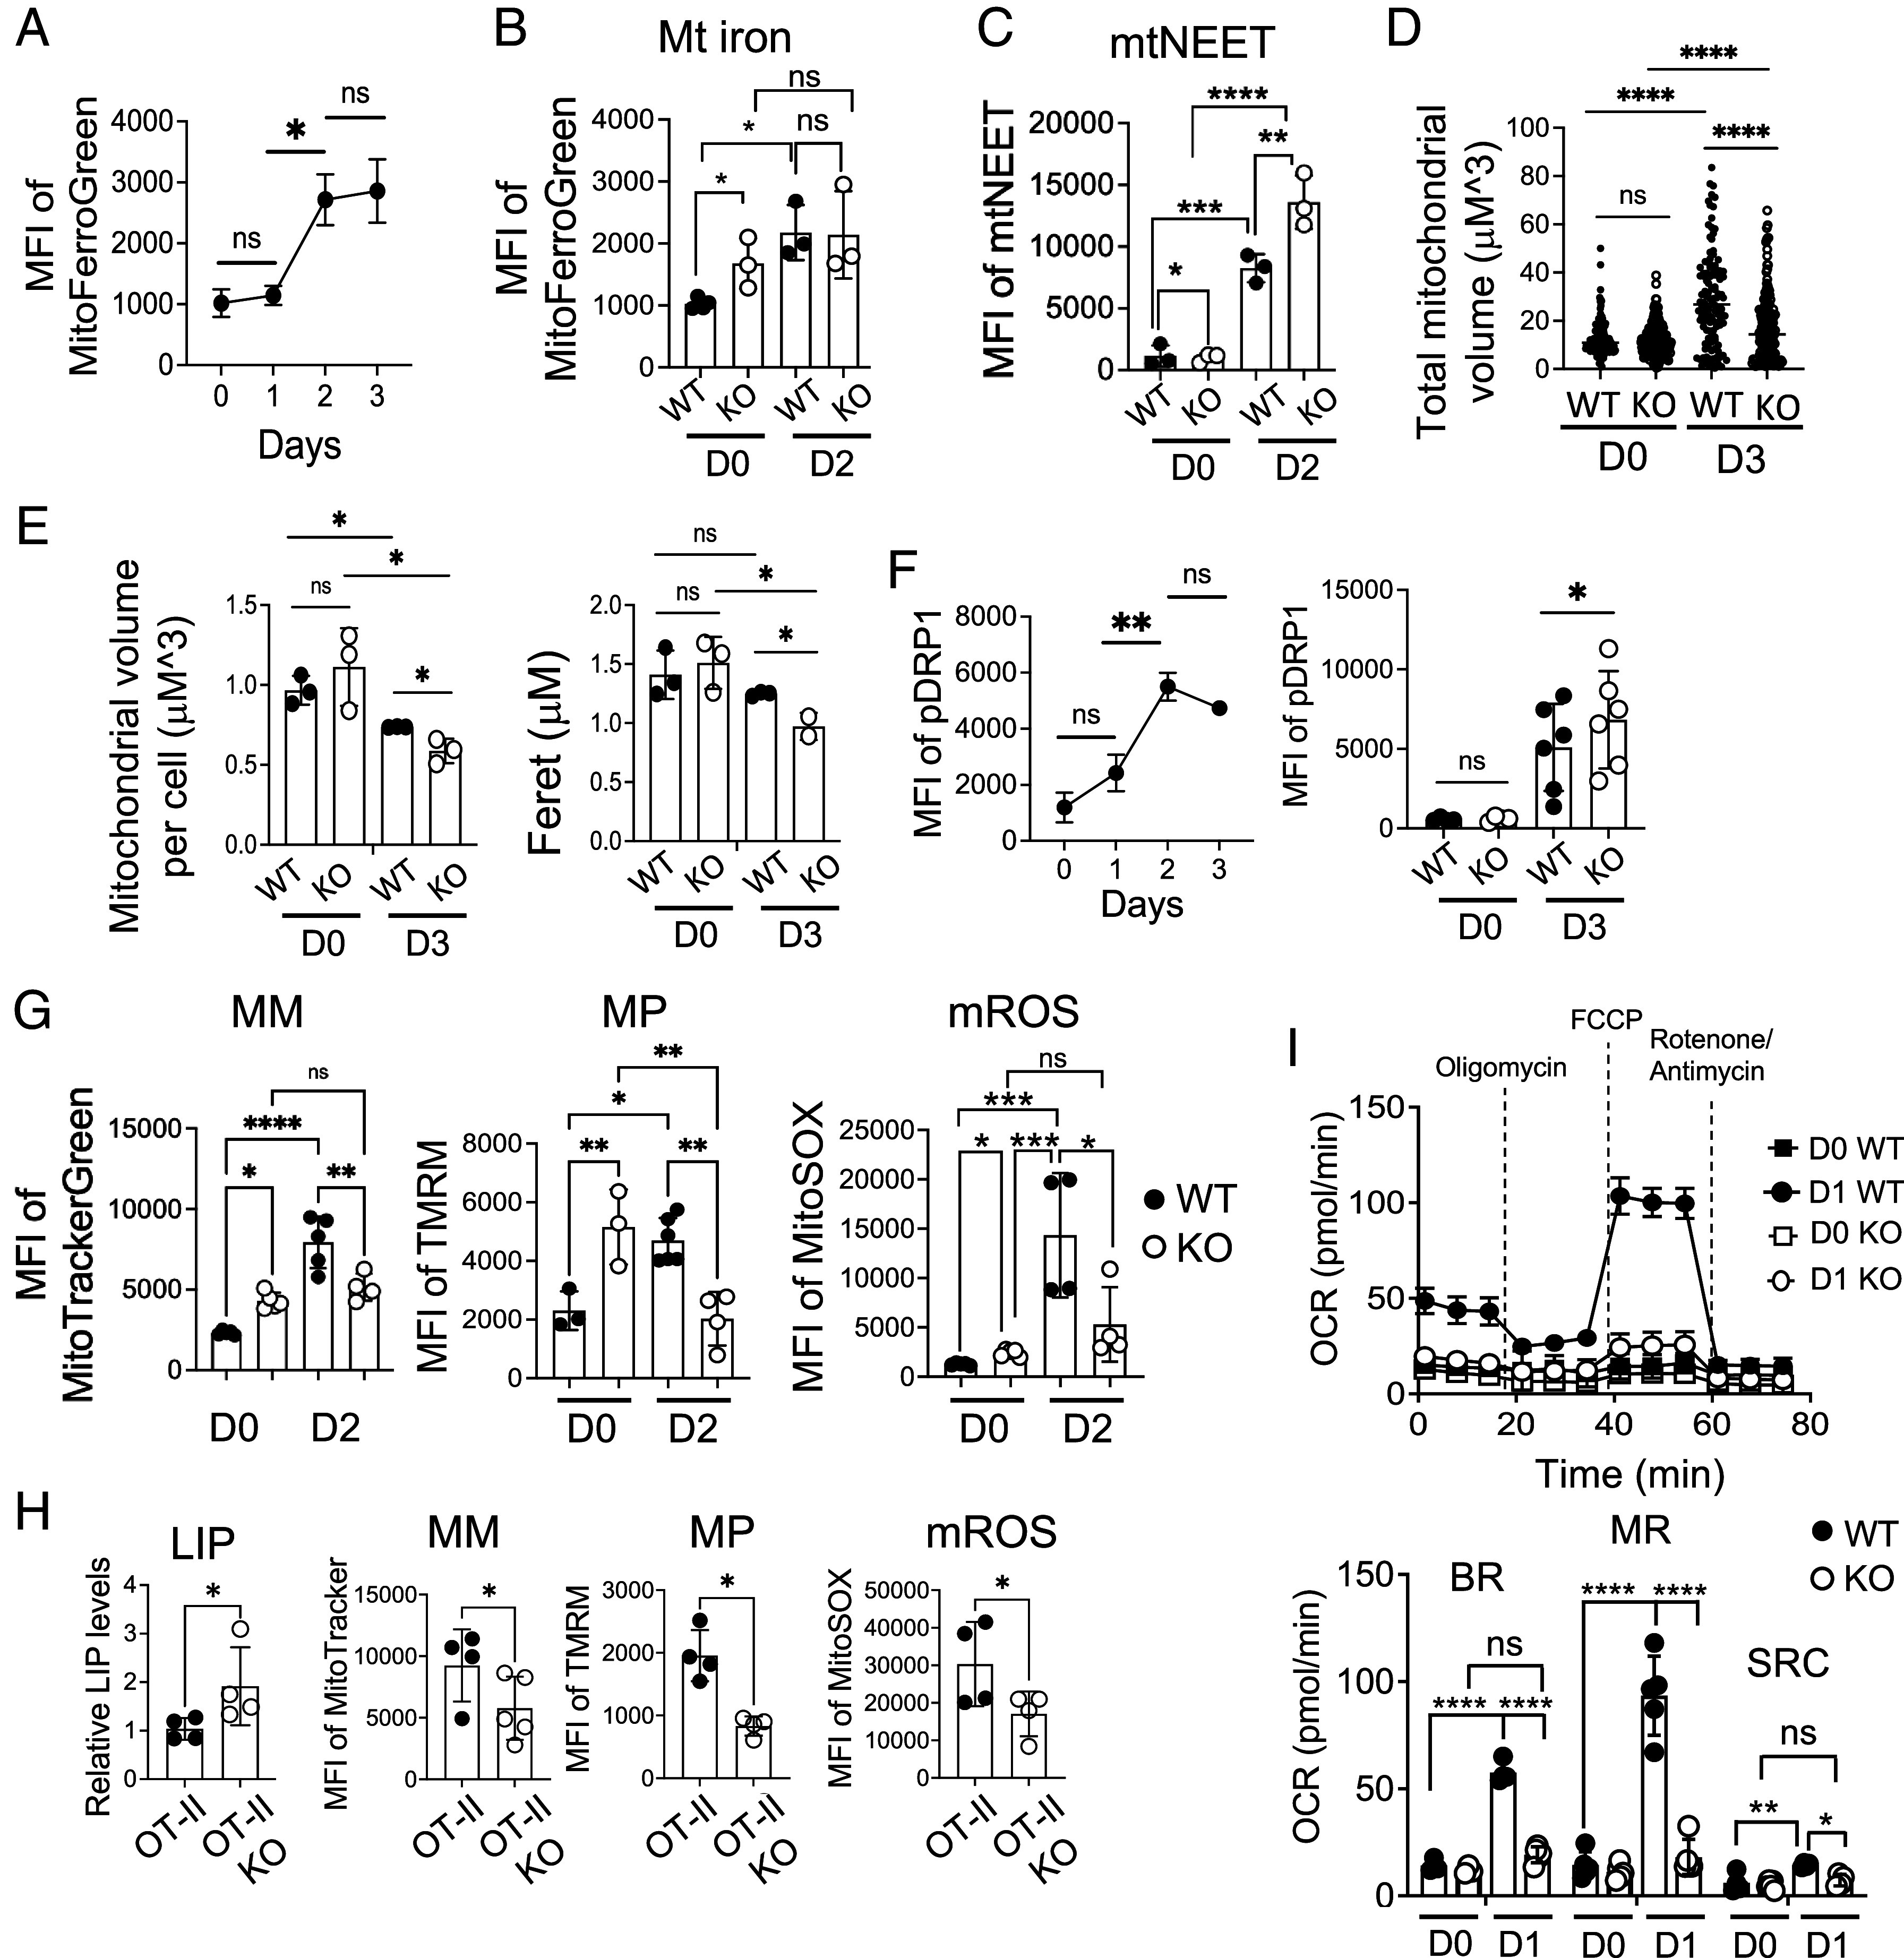
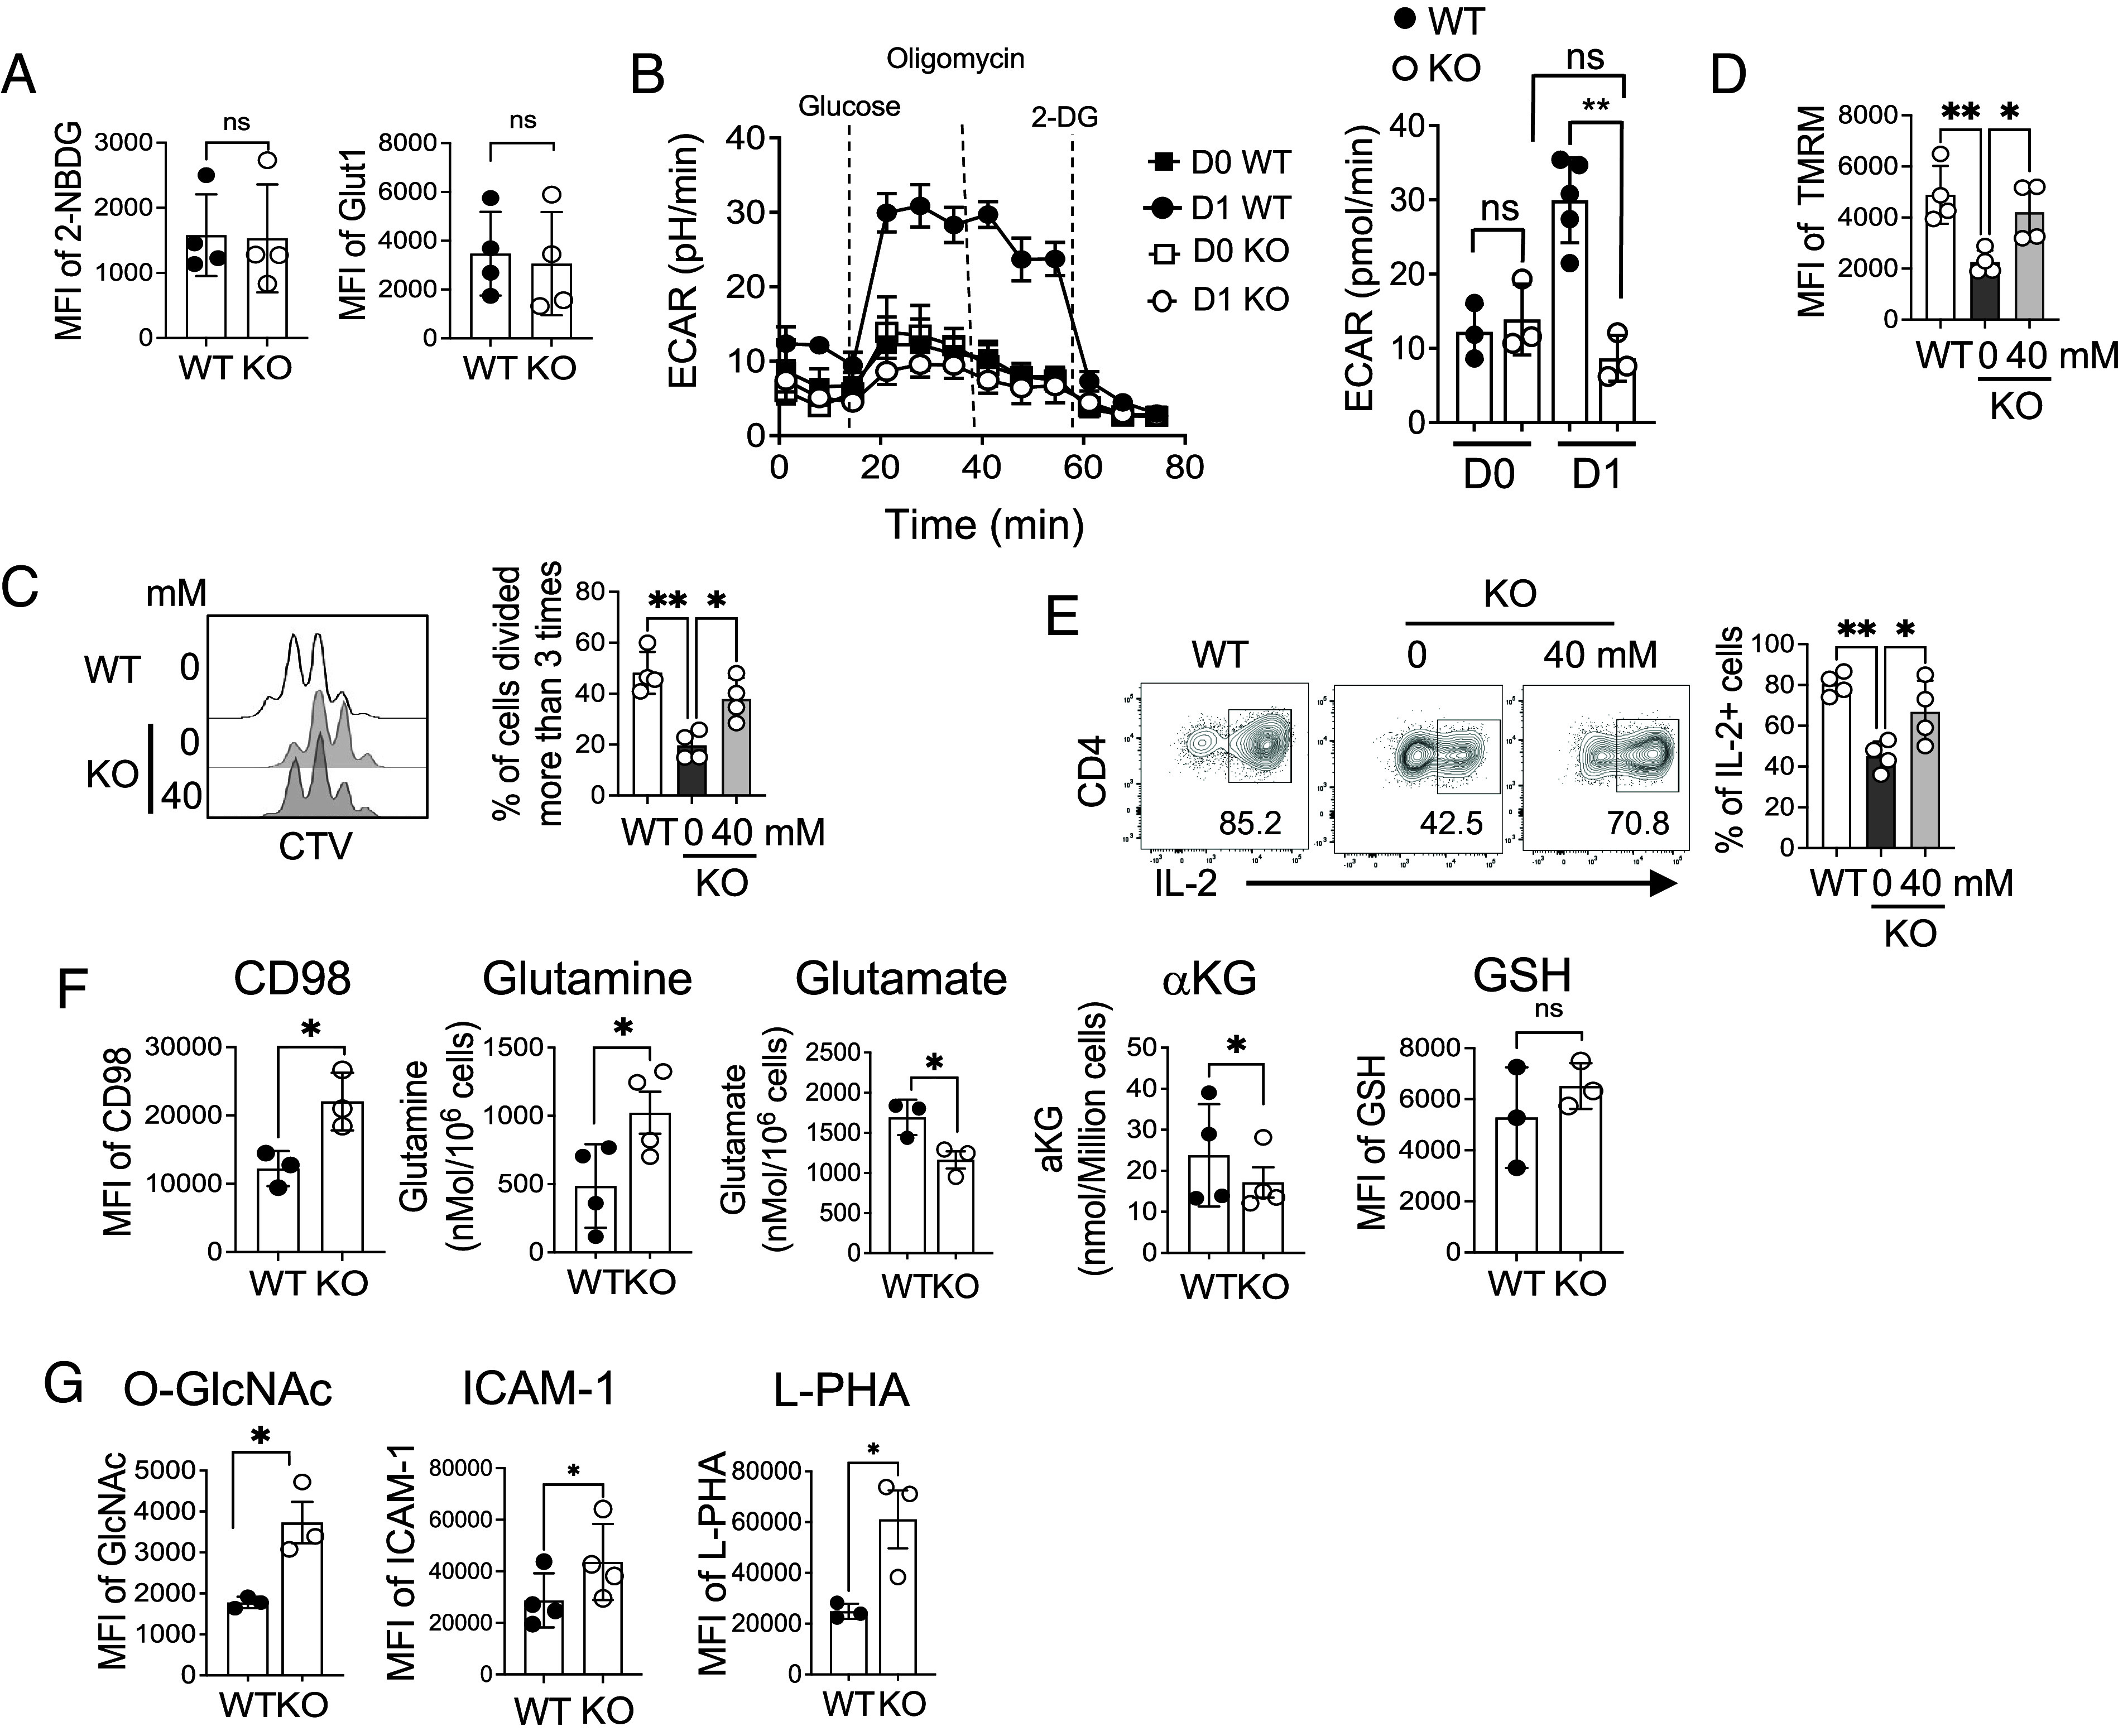
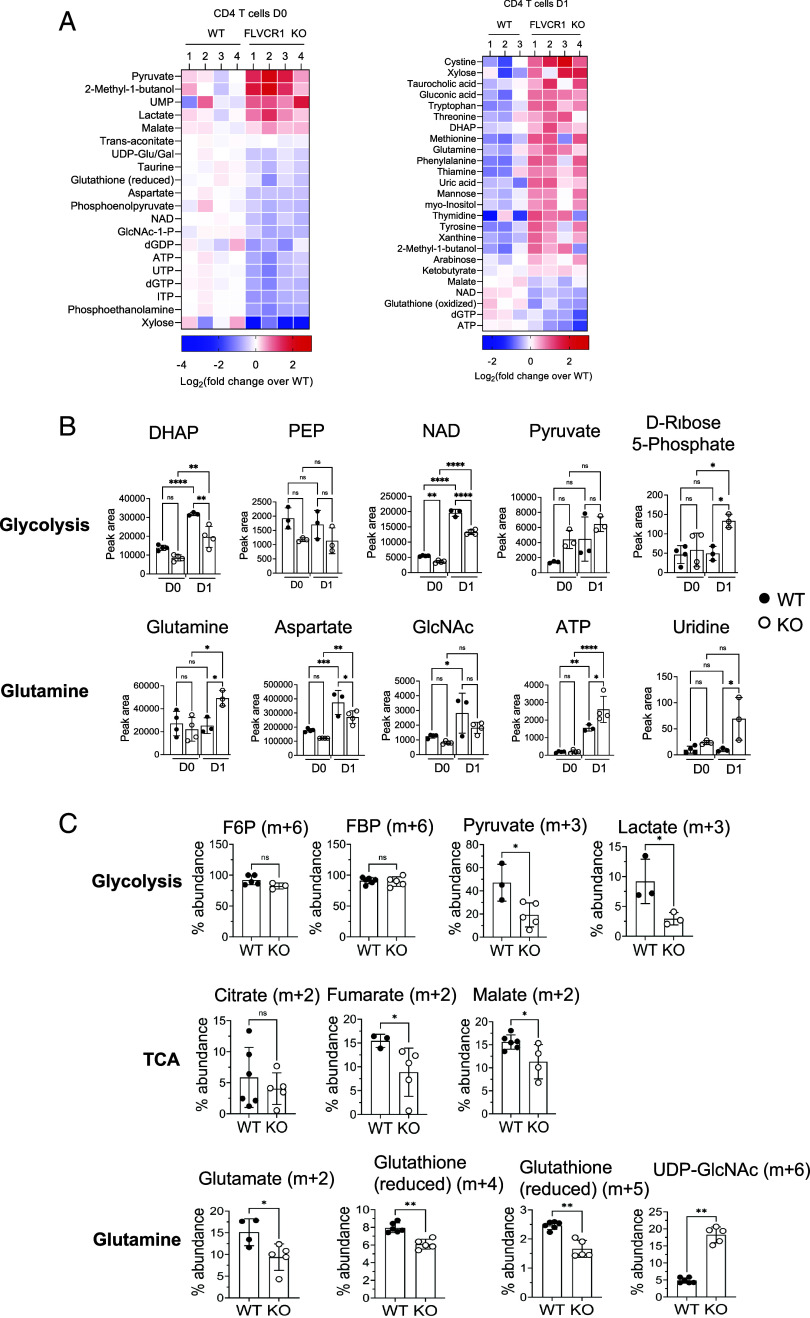
In response to an immune challenge, naive T cells undergo a transition from a quiescent to an activated state acquiring the effector function. Concurrently, these T cells reprogram cellular metabolism, which is regulated by iron. We and others have shown that iron homeostasis controls proliferation and mitochondrial function, but the underlying mechanisms are poorly understood. Given that iron derived from heme makes up a large portion of the cellular iron pool, we investigated iron homeostasis in T cells using mice with a T cell-specific deletion of the heme exporter, FLVCR1 [referred to as knockout (KO)]. Our finding revealed that maintaining heme and iron homeostasis is essential to keep naive T cells in a quiescent state. KO naive CD4 T cells exhibited an iron-overloaded phenotype, with increased spontaneous proliferation and hyperactive mitochondria. This was evidenced by reduced IL-7R and IL-15R levels but increased CD5 and Nur77 expression. Upon activation, however, KO CD4 T cells have defects in proliferation, IL-2 production, and mitochondrial functions. Iron-overloaded CD4 T cells failed to induce mitochondrial iron and exhibited more fragmented mitochondria after activation, making them susceptible to ferroptosis. Iron overload also led to inefficient glycolysis and glutaminolysis but heightened activity in the hexosamine biosynthetic pathway. Overall, these findings highlight the essential role of iron in controlling mitochondrial function and cellular metabolism in naive CD4 T cells, critical for maintaining their quiescent state.

Keywords: heme; iron; mitochondria; tonic signaling.


Conflict of interest statement

Competing interests statement:In the past 3 y, C.A.L. has consulted for Astellas Pharmaceuticals, Odyssey Therapeutics, Third Rock Ventures, and T-Knife Therapeutics, and is an inventor on patents pertaining to Kras regulated metabolic pathways, redox control pathways in pancreatic cancer, and targeting the GOT1-ME1 pathway as a therapeutic approach (US Patent No: 2015126580-A1, 05/07/2015; US Patent No: 20190136238, 05/09/2019; International Patent No: WO2013177426-A2, 04/23/2015).

Figures

Fig. 1.
Fig. 1.
Increased intracellular iron in FLVCR1 KO naive CD4 T cells. (AC) Enriched naive CD4 T cells from C57BL/6 mice were activated with anti-CD3 and anti-CD28 antibodies as described in Materials and Methods. (A) Total cell lysate at indicated time points after stimulation and unstimulated (D0) cells were used to measure intracellular heme levels (n = 3). (B) RNA was isolated from naive CD4 T cells at indicated time points and used for gene expression analysis using qPCR. A bar graph represents the relative gene expression of FLVCR1 (n = 3). (C) HO-1 protein expression was measured by flow cytometry, and the mean fluorescence intensity (MFI) was shown (n = 3). (D and E) Naive CD4 T cells from WT and KO mice were sorted and analyzed for the indicated parameters. (D) Graphs show the heme (Left) and HO-1 levels (Right) in naive CD4 T cells (n = 4 to 5). (E) Total cell lysate was prepared from naive CD4 T cells and subjected to ICP-MS analysis. The graph shows the total iron level (reported in parts per billion per 1 × 10⁶ cells) (n = 2). (F and G) Naive CD4 T cells (CD62LhiCD44lo) in total splenocytes were analyzed for the indicated parameters. (F) Graphs show the LIP measured using Calcein staining (Left) (n = 5) and ferrous iron with FerrroOrange (Right) (n = 5). (G) Levels of TfR1, ferritin, and Fpn were compared by flow cytometry. Graphs show MFI of TfR1 (n = 4), ferritin (n = 6), and Fpn (n = 5) in naive CD4 T cells. The data are the cumulative result of at least three independent experiments. Error bars represent the mean ± SEM. *P < 0.05, **P < 0.01, ****P < 0.0001, ns: not significant.
Fig. 2.
Fig. 2.
FLVCR1 deletion alters the homeostasis of naive CD4 T cells. (A) Naive CD4 T cells in total splenocytes were examined for Annexin V. The representative histograms and the bar graph show % Annexin V+ naive CD4 T cells from WT and KO mice (n = 4). (B) Graphs show percentages of Ki-67+ in splenic naive (Left), and effector CD4 T cells (Middle), and single positive CD4 T cells from the thymus (Right) (n = 3 to 5). (C and D) Graphs show the expression of IL-7Ra (CD127) and IL-15R (CD122) (C), and CD5 and Nur77 (D) in naive CD4 T cells. The Top and Bottom panels show cells from the spleens and thymus, respectively (n = 4 to 7). (E) Total splenocytes from WT and KO mice were subjected to intracellular staining for the signaling molecules pERK, pNF-kB, pSTAT5, and pS6. Graphs show the expression of these signaling molecules in naive CD4 T cells (n = 4). (F and G) Total splenocytes from OT-II and OT-II KO mice were analyzed for the distributions of naive and effector CD4 T cells. (F) The representative dot plots show the percentages of naive and effector CD4 T cells in OT-II (Va2+ Vb5+) and non-OT-II (Va2 Vb5) CD4 T cells from OT-II and OT-II KO mice (n = 4). (G) Dot plots and the graph show percentages of Ki-67+ naive CD4 T cells in the spleen (n = 4). The data are representative of at least three independent experiments. Error bars represent the mean ± SEM. *P < 0.05, **P < 0.01, ns: not significant.
Fig. 3.
Fig. 3.
Iron overload is detrimental to naive CD4 T cells in response to TCR stimulation. Sorted naive CD4 T cells from the spleens of WT and KO mice were labeled with CellTrace™ Violet (CTV) and then activated with anti-CD3 and anti-CD28 antibodies for 3 d as described in Materials and Methods. (A) Graphs show levels of heme (Left) and HO-1 (Right) in activated CD4 T cells (n = 4 to 5). (B and C) The graphs show the expression of the indicated parameters (n = 3 to 5). (D) The representative histograms and the summary graph show the percentages of Annexin V+ in activated CD4 T cells from WT and KO mice (n = 4). (E) Cells were stained with a lipid-peroxidation reagent. The graph shows the ratio of fluorescence intensity of FITC over PE. (F) The representative histograms and the summary graph show cell proliferation (n = 5). (G) Cells were stimulated with PMA and ionomycin for 4 h and then analyzed for intracellular IL-2 expression. Representative dot plots show the percentage of IL-2+ CD4 T cells (n = 3). The summary graph shows the amount of IL-2 secreted into the media at indicated time points as measured by ELISA (n = 9). (H) Enriched naive CD4 T cells from OT-II and OT-II KO mice were stimulated with dendritic cells in the presence of 100 mg/mL of Ova protein for 3 d. Cells were also activated with anti-CD3 and anti-CD28 antibodies. The representative histograms depict cell proliferation (n = 4). (I) Cells in (H) were restimulated with PMA and ionomycin for 4 h and then assessed for the expression of IL-2 cytokine. Representative dot plots and the summary graph show the percentages of IL-2+ OT-II CD4 T cells (n = 3). (J) The graph shows CD25 expression in activated CD4 T cells (n = 4). (K) Activated CD4 cells were subjected to intracellular staining of pSTAT5 and pS6. The data are representative of three independent experiments. Error bars represent the mean ± SEM. *P < 0.05, **P < 0.01, ***P < 0.001, ns: not significant.
Fig. 4.
Fig. 4.
Mitochondrial fitness and function are compromised in iron-overloaded CD4 T cells. (A) Enriched naive CD4 T cells from C57BL/6 mice were activated and analyzed for mitochondrial iron levels using MFG. The graph shows the MFI of MFG over time (n = 4). (B and C) Sorted naive CD4 T cells from WT and KO mice were activated for 2 d. Graphs show mitochondrial iron (B) and the expression of mtNEET (C) from unstimulated (D0) and stimulated (D2) CD4 T cells (n = 3). (D and E) Sorted naive CD4 T cells from WT and FLVCR1 KO mice were activated for 3 d. Unstimulated (D0) and stimulated cells (D3) were subjected to ATP synthase (ATPB) staining to mark mitochondria and DAPI for nuclei, followed by visualization via the Zeiss Axio Observer with multichannel LED illumination. Analysis of the mitochondrial volume and length was performed using a custom FIJI macro script. (D) The graph shows the total volume of mitochondria of WT and KO before and after activation (n = 2 to 3). (E) Graphs show the volume (Left) and the length (Right) of mitochondria. A total number of 661 cells were examined (n = 2 to 3). (F) Enriched WT and KO naive CD4 T cells were activated and analyzed for pDrp1 expression. The Left graph shows the MFI of pDrp1 over time (n = 3). The Right graph shows pDrp1Ser616 expression in unstimulated (D0) and stimulated (D3) CD4 T cells from WT and KO mice (n = 4 to 6). (G) Sorted naive CD4 T cells from WT and FLVCR1 KO were activated for 2 d and subjected to MitoTracker, TMRM, and MitoSOX staining. The graphs show MFI values of MitoTracker, TMRM, and MitoSOX from unstimulated (D0) and stimulated cells (D2), depicting MM, MP, and mROS respectively (n = 3 to 5). (H) Enriched naive CD4 T cells from OT-II and OT-II KO mice were stimulated with dendritic cells in the presence of 100 mg/mL of Ova protein for 3 d. The graphs show LIP levels and MFI of MitoTracker green, TMRM, and MitoSOX (n = 4). (I) Naive CD4 T cells from WT and KO mice were activated for 1 d. The representative graph at the Top shows OCR using the Mito Stress Test in the Seahorse assay from unstimulated (D0) and stimulated cells (D1). The bar graph at the Bottom shows BR, maximum respiratory capacity (MRC), and reserve capacity (RC) (n = 6). The data are representative of at least three independent experiments. Error bars represent the mean ± SEM. *P < 0.05, **P < 0.01, ***P < 0.001, ****P < 0.0001, ns: not significant.
Fig. 5.
Fig. 5.
Iron controls glucose and glutamine metabolism in CD4 T cells. (A) Sorted naive CD4 T cells from WT and KO mice were activated for 3 d and compared for 2-NBDG uptake (Left) and expression of Glut1 (n = 4). (B) Sorted naive CD4 T cells were activated for 1 d and subjected to the Seahorse assay. The representative graph on the Left side shows ECAR using the glycolytic stress test from unstimulated (D0) and stimulated cells (D1). The bar graph on the Right side shows glycolytic capacity (n = 6). (CE) Sorted naive CD4 T cells from KO mice were stimulated for 3 d in the presence of sodium-lactate. (C) The representative histograms and graph show cell proliferation (n = 4). (D) The graph shows TMRM of activated CD4 T cells with or without sodium-lactate. (E) The same cells were restimulated with PMA and ionomycin for 4 h and then analyzed for IL-2 cytokine. (F and G) Sorted naive CD4 T cells from WT and KO mice were activated with anti-CD3 and anti-CD28 antibodies for 3 d and analyzed for the indicated parameters. The graphs in (F) show the MFI of CD98 and amounts of glutamine and glutamate, αKG, and GSH levels in activated CD4 T cells (n = 3 to 4). (G) Graphs show MFI of intracellular levels of O-GlcNAc modification, ICAM-1 on the cell surface, and L-PHA levels in activated CD4 T cells (n = 3 to 4). The data are representative of at least three independent experiments. Error bars represent the mean ± SEM. *P < 0.05, **P < 0.01, ***P < 0.001, ns: not significant.
Fig. 6.
Fig. 6.
Iron overload remodels metabolic programming in naive CD4 T cells. Sorted naive CD4 T cells from WT and KO mice were activated, and metabolites were extracted from unstimulated (D0) and stimulated cells (D1). Metabolite extracts were subjected to targeted metabolomic analysis using LC–MS/MS with a reference library of 230 metabolites. (A) Heat maps show significantly different amounts of metabolites between KO and WT naive CD4 T cells at D0 (Left) and D1 (Right) (n = 3). (B) Graphs show relative levels of the indicated metabolites from glucose (Upper) and glutamine (Lower) metabolism pathways (n = 3 to 4). (C) WT and KO naive CD4 T cells were stimulated for 1 d in glucose-free RPMI containing glutamine (2 mM) and [13C6]-glucose (11 mM). After 1 d of activation, cell extract was prepared and subjected to LC–MS analysis. Representative graphs show the percentage abundance of 13C6-glucose-derived carbon in glycolysis (F6P, FBP, pyruvate, and lactate), TCA cycle (citrate, fumarate, and malate), glutamine metabolism (glutamate and GSH) and HBP (UDP-GlcNAc) intermediate metabolites. The error bars represent the mean ± SEM. *P < 0.05, **P < 0.01, ***P < 0.001, ns: not significant.

References

    1. Azzam H. S., et al. , CD5 expression is developmentally regulated by T cell receptor (TCR) signals and TCR avidity. J. Exp. Med. 188, 2301–2311 (1998). - PMC - PubMed
    1. Stefanova I., Dorfman J. R., Germain R. N., Self-recognition promotes the foreign antigen sensitivity of naive T lymphocytes. Nature 420, 429–434 (2002). - PubMed
    1. Yarosz E. L., et al. , Cutting edge: Activation-induced iron flux controls CD4 T cell proliferation by promoting proper IL-2R signaling and mitochondrial function. J. Immunol. 204, 1708–1713 (2020). - PMC - PubMed
    1. Lai Y., et al. , Iron controls T helper cell pathogenicity by promoting glucose metabolism in autoimmune myopathy. Clin. Transl. Med. 12, e999 (2022). - PMC - PubMed
    1. Frost J. N., et al. , Hepcidin-mediated hypoferremia disrupts immune responses to vaccination and infection. Med 2, 164–179.e12 (2021). - PMC - PubMed

LinkOut - more resources