. 2024 May;5(5):e468-e477.
doi: 10.1016/S2666-5247(23)00399-3. Epub 2024 Apr 12.

Optimisation and evaluation of viral genomic sequencing of SARS-CoV-2 rapid diagnostic tests: a laboratory and cohort-based study

Affiliations

Optimisation and evaluation of viral genomic sequencing of SARS-CoV-2 rapid diagnostic tests: a laboratory and cohort-based study

Jillian S Paull et al. Lancet Microbe. 2024 May.

Abstract

Background: Sequencing of SARS-CoV-2 from rapid diagnostic tests (RDTs) can bolster viral genomic surveillance efforts; however, approaches to maximise and standardise pathogen genome recovery from RDTs remain underdeveloped. We aimed to systematically optimise the elution of genetic material from RDT components and to evaluate the efficacy of RDT sequencing for outbreak investigation.

Methods: In this laboratory and cohort-based study we seeded RDTs with inactivated SARS-CoV-2 to optimise the elution of genomic material from RDT lateral flow strips. We measured the effect of changes in buffer type, time in buffer, and rotation on PCR cycle threshold (Ct) value. We recruited individuals older than 18 years residing in the greater Boston area, MA, USA, from July 18 to Nov 5, 2022, via email advertising to students and staff at Harvard University, MA, USA, and via broad social media advertising. All individuals recruited were within 5 days of a positive diagnostic test for SARS-CoV-2; no other relevant exclusion criteria were applied. Each individual completed two RDTs and one PCR swab. On Dec 29, 2022, we also collected RDTs from a convenience sample of individuals who were positive for SARS-CoV-2 and associated with an outbreak at a senior housing facility in MA, USA. We extracted all returned PCR swabs and RDT components (ie, swab, strip, or buffer); samples with a Ct of less than 40 were subject to amplicon sequencing. We compared the efficacy of elution and sequencing across RDT brands and components and used RDT-derived sequences to infer transmission links within the outbreak at the senior housing facility. We conducted metagenomic sequencing of negative RDTs from symptomatic individuals living in the senior housing facility.

Findings: Neither elution duration of greater than 10 min nor rotation during elution impacted viral titres. Elution in Buffer AVL (Ct=31·4) and Tris-EDTA Buffer (Ct=30·8) were equivalent (p=0·34); AVL outperformed elution in lysis buffer and 50% lysis buffer (Ct=40·0, p=0·0029 for both) as well as Universal Viral Transport Medium (Ct=36·7, p=0·079). Performance of RDT strips was poorer than that of matched PCR swabs (mean Ct difference 10·2 [SD 4·3], p<0·0001); however, RDT swabs performed similarly to PCR swabs (mean Ct difference 4·1 [5·2], p=0·055). No RDT brand significantly outperformed another. Across sample types, viral load predicted the viral genome assembly length. We assembled greater than 80% complete genomes from 12 of 17 RDT-derived swabs, three of 18 strips, and four of 11 residual buffers. We generated outbreak-associated SARS-CoV-2 genomes using both amplicon and metagenomic sequencing and identified multiple introductions of the virus that resulted in downstream transmission.

Interpretation: RDT-derived swabs are a reasonable alternative to PCR swabs for viral genomic surveillance and outbreak investigation. RDT-derived lateral flow strips yield accurate, but significantly fewer, viral reads than matched PCR swabs. Metagenomic sequencing of negative RDTs can identify viruses that might underlie patient symptoms.

Funding: The National Science Foundation, the Hertz Foundation, the National Institute of General Medical Sciences, Harvard Medical School, the Howard Hughes Medical Institute, the US Centers for Disease Control and Prevention, the Broad Institute and the National Institute of Allergy and Infectious Diseases.


Conflict of interest statement

Declaration of interests PCS is a cofounder of, shareholder in, and advisor to Sherlock Biosciences; a board member of and shareholder in the Danaher Corporation; a cofounder of and shareholder in Delve Bio; and a shareholder in NextGenJane and TruGenomix. MS is a cofounder of, shareholder in, and advisor to Rhinostics; a shareholder of and advisor to Nexus Laboratories; and a consultant for Vectis Consulting. All other authors declare no competing interests.

Figures

Figure 1:
Figure 1:. Study overview
A protocol to sequence SARS-CoV-2 from RDT strips was developed using synthetic samples to seed rapid tests. The protocol was evaluated across three RDT brands relative to the gold standard (PCR swabs) within and across individuals. Sequencing of RDTs was implemented in the investigation of an outbreak in a senior living apartment building. Transmission inference and outbreak reconstruction were performed with genomes generated from residual RDT components. Figure created with BioRender.com. RDT=rapid diagnostic test. RT-qPCR=RT-quantitative PCR.
Figure 2:
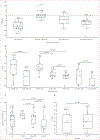
Figure 2:. Optimisation of rapid diagnostic test elution via synthetic samples
Data points are the medians of three technical PCR replicates. Boxplots show quartiles of the dataset, with whiskers extending to points within 1⋅5 IQR of the lower or upper quartile (all plotted with the seaborn.boxplot function). p values were calculated via t test. Water controls are negative controls that underwent RNA extraction, and NTCs were added to PCR post-extraction. (A) The Ct values (y axis; inverted) for synthetic samples that were eluted in five different buffers (x axis). (B–C) The Ct values (y axis; inverted) for synthetic samples that were eluted for varying time lengths (x axis). (C) Elution occurred with or without rotation (x axis). (D) The Ct values (y axis; inverted) for RDT strips (light grey) or viral seedstock (dark grey), plotted against the number of days that seedstock and seeded strips were left at room temperature. Least-squares linear regression models were fit using each set of data points; shaded areas represent 95% CIs. For strips, the slope was −0⋅06 (95% CI −0⋅23 to 0⋅10; y axis inverted). For seedstock, the slope was 0⋅33 (0⋅07 to 0⋅58; y axis inverted). (E) The Ct values (y axis; inverted) for synthetic samples that were extracted using either QIAamp spin-column extraction or KingFisher automated extraction. AVL=Buffer AVL. Ct=cycle threshold. KFF=KingFisher Flex System. LB=lysis buffer solution. NTC=no-template controls. RDT=rapid diagnostic test. TE=Tris EDTA buffer pH 8. VTM=Universal Viral Transport Medium.
Figure 3:
Figure 3:. Evaluation of rapid diagnostic test extraction performance
Plotted values are the medians of three technical PCR replicates. Boxplots show quartiles of the dataset, with whiskers extending to points within 1⋅5 IQR of the lower or upper quartile (all plotted with the seaborn.boxplot function). p values were calculated via Wilcoxon signed-rank test. (A) The difference in Ct values (y axis) between corresponding RDT components (swab, strip, and residual buffer) and polypropylene PCR swabs. The difference is calculated as the Ct value of the second member of the comparison subtracted from the Ct value of the first member of the comparison (ie, PCR vs RDT swab is calculated as each relevant individual’s RDT swab Ct value subtracted from their PCR Ct value). This analysis includes individuals from both cohorts. (B) The Ct values (y axis; inverted) for RDT components collected from SARS-CoV-2 positive individuals. This analysis includes individuals from either cohort who collected and returned all components of a particular RDT. (C) The difference in Ct values (y axis) between RDT strips (by brand) and corresponding polypropylene PCR swabs from SARS-CoV-2-positive individuals in cohort 1. (D) The Ct values (y axis; inverted) from the first and second RDT strips collected from SARS-CoV-2 positive individuals in cohort 1. Ct=cycle threshold. RDT=rapid diagnostic test.
Figure 4:
Figure 4:. Evaluation of RDT sequencing performance
(A) Difference in percent of unambiguous genome assembled from sequencing of RDT components and corresponding PCR swabs. (B) Percent of unambiguous genome assembled versus Ct value for genomes produced from RDT components or PCR swabs. Plotted values are the medians of three technical PCR replicates. Values are shown as circles or crosses to designate whether viral lineage assignment was possible. Dashed lines indicate a Ct value of 32 and a percent genome assembly of 80%. Ct=cycle threshold. RDT=rapid diagnostic test.
Figure 5:
Figure 5:. Identification of transmission links in a cluster
(A) Pairwise SNV distance matrix for eight identified XBB.1.5 cases (top right) and four identified EF.1.2 cases (bottom left) in the outbreak. Number of SNV differences between each pair is shown in cells and is excluded for pairs that are identical (ie, SNV distance of 0). (B) Outbreak transmission reconstruction network, generated via outbreaker2, showing putative person-to-person transmission events. Circles represent SARS-CoV-2 positive individuals, circle colour indicates genome lineage, and arrows connecting circles indicate the presence and directionality of a putative transmission event. Arrows are annotated with the posterior probability of a given transmission and are shown only for transmission events with a posterior probability of at least 0⋅25. SNV=single-nucleotide variant.

References

    1. Larremore DB, Wilder B, Lester E, et al. Test sensitivity is secondary to frequency and turnaround time for COVID-19 screening. Sci Adv 2021; 7: eabd5393. - PMC - PubMed
    1. Korenkov M, Poopalasingam N, Madler M, et al. Evaluation of a rapid antigen test to detect SARS-CoV-2 infection and identify potentially infectious individuals. J Clin Microbiol 2021; 59: e0089621. - PMC - PubMed
    1. DNA Pipelines R&D, Farr B, Rajan D, et al. COVID-19 ARTIC v4.1 Illumina library construction and sequencing protocol - tailed method V.2 March 31, 2022. 10.17504/protocols.io.j8nlk4b36g5r/v2 (accessed Oct 12, 2023). - DOI
    1. Petros BA, Paull JS, Tomkins-Tinch CH, et al. Multimodal surveillance of SARS-CoV-2 at a university enables development of a robust outbreak response framework. Med 2022; 3: 883–900. - PMC - PubMed
    1. Nazario-Toole A, Nguyen HM, Xia H, Frankel DN, Kieffer JW, Gibbons TF. Sequencing SARS-CoV-2 from antigen tests. PLoS One 2022; 17: e0263794. - PMC - PubMed

Publication types