. 2024 Jun:84:101939.
doi: 10.1016/j.molmet.2024.101939. Epub 2024 Apr 16.

Neuronal E93 is required for adaptation to adult metabolism and behavior

Affiliations

Neuronal E93 is required for adaptation to adult metabolism and behavior

Cecilia Yip et al. Mol Metab. 2024 Jun.

Abstract

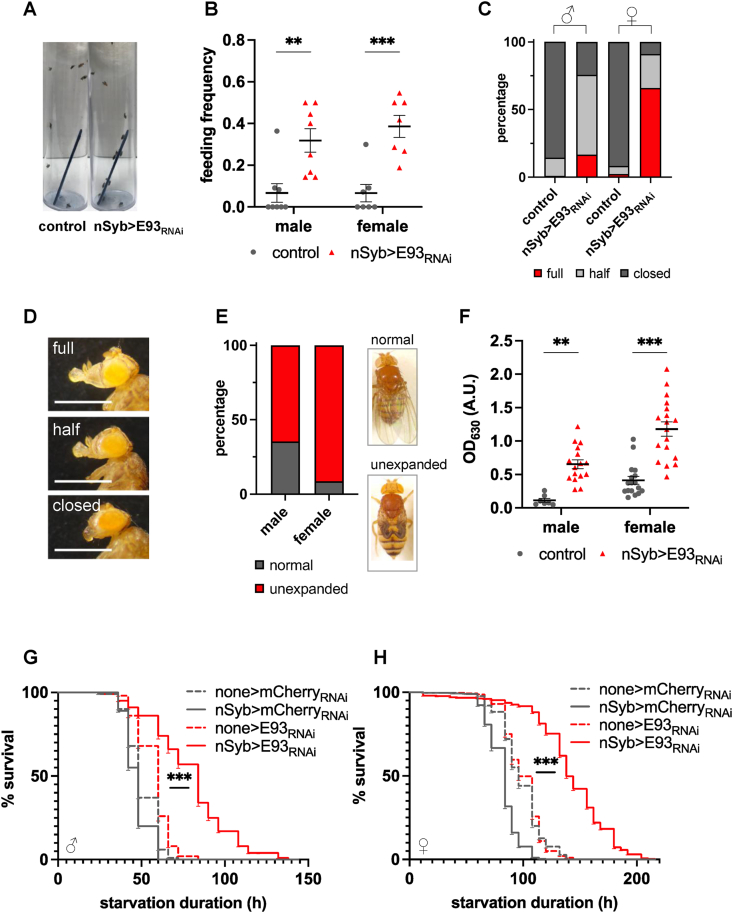
Objective: Metamorphosis is a transition from growth to reproduction, through which an animal adopts adult behavior and metabolism. Yet the neural mechanisms underlying the switch are unclear. Here we report that neuronal E93, a transcription factor essential for metamorphosis, regulates the adult metabolism, physiology, and behavior in Drosophila melanogaster.

Methods: To find new neuronal regulators of metabolism, we performed a targeted RNAi-based screen of 70 Drosophila orthologs of the mammalian genes enriched in ventromedial hypothalamus (VMH). Once E93 was identified from the screen, we characterized changes in physiology and behavior when neuronal expression of E93 is knocked down. To identify the neurons where E93 acts, we performed an additional screen targeting subsets of neurons or endocrine cells.

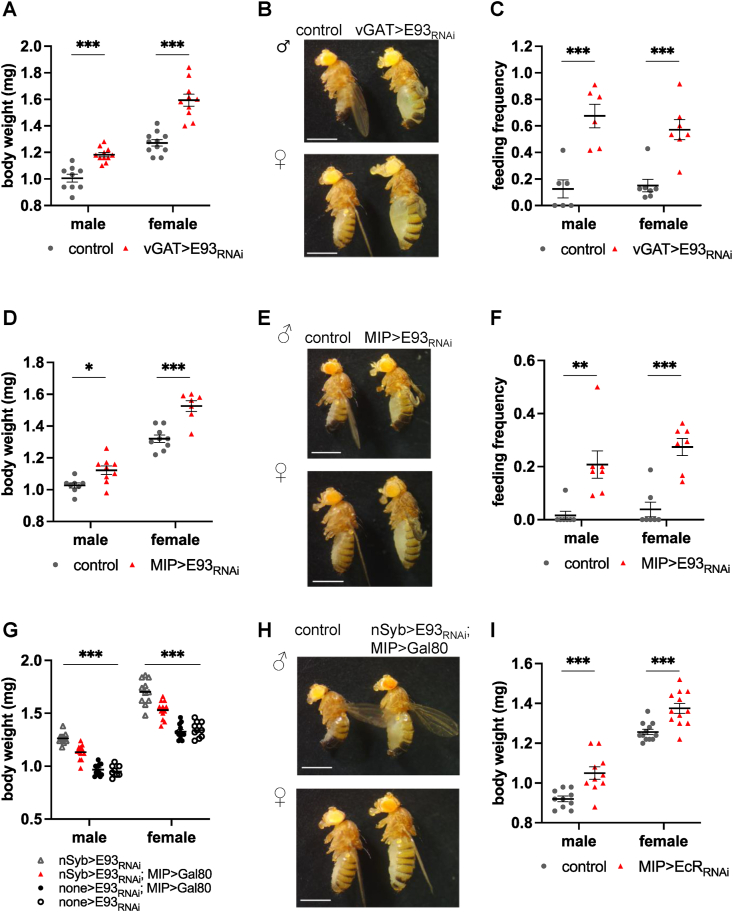
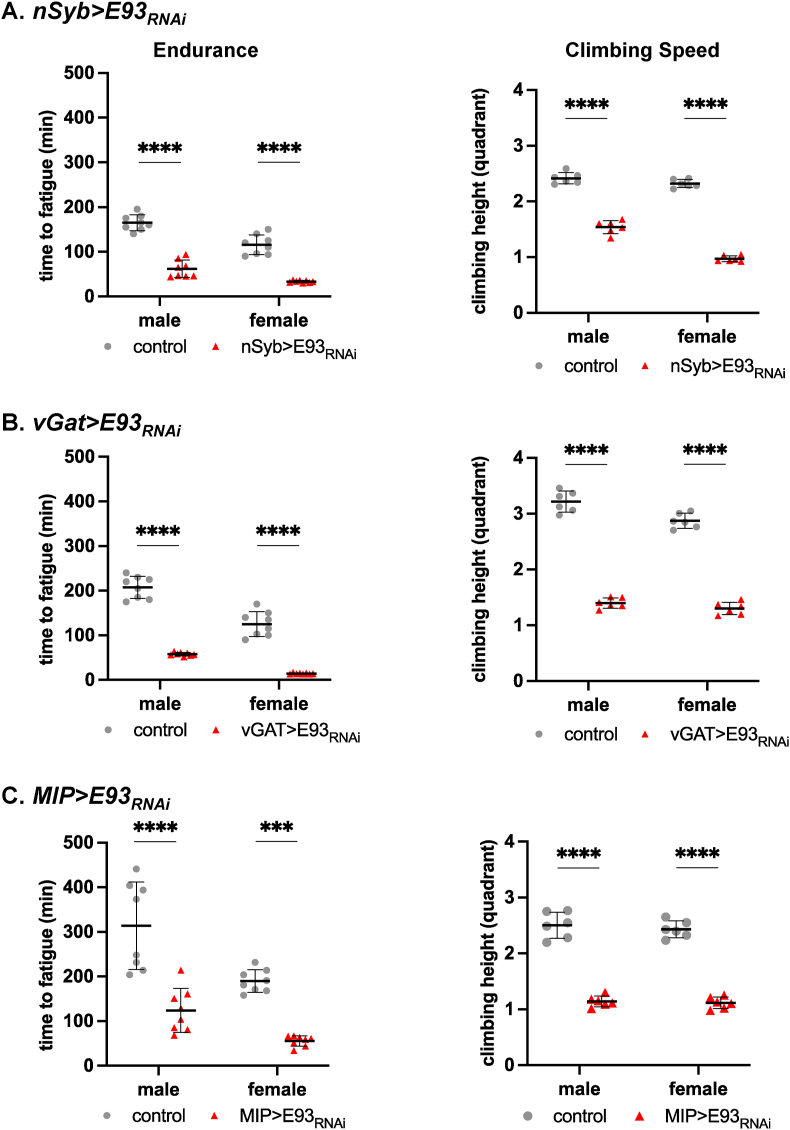
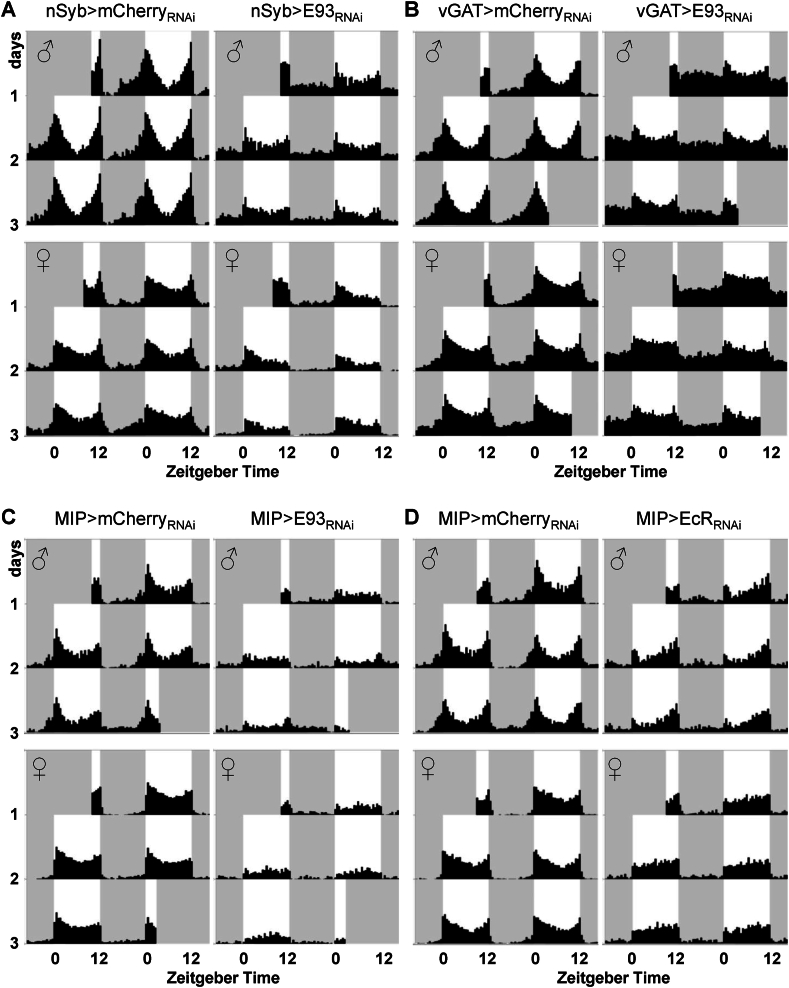
Results: E93 is required to control appetite, metabolism, exercise endurance, and circadian rhythms. The diverse phenotypes caused by pan-neuronal knockdown of E93, including obesity, exercise intolerance and circadian disruption, can all be phenocopied by knockdown of E93 specifically in either GABA or MIP neurons, suggesting these neurons are key sites of E93 action. Knockdown of the Ecdysone Receptor specifically in MIP neurons partially phenocopies the MIP neuron-specific knockdown of E93, suggesting the steroid signal coordinates adult metabolism via E93 and a neuropeptidergic signal. Finally, E93 expression in GABA and MIP neurons also serves as a key switch for the adaptation to adult behavior, as animals with reduced expression of E93 in the two subsets of neurons exhibit reduced reproductive activity.

Conclusions: Our study reveals that E93 is a new monogenic factor essential for metabolic, physiological, and behavioral adaptation from larval behavior to adult behavior.

Keywords: Adult behavior; Brain rewiring; Circadian rhythm; Exercise endurance; Monogenic factor of obesity; Neuronal regulation of feeding; Systemic metabolic failure.


Conflict of interest statement

Declaration of competing interest The authors declare that there are no conflicts of interest.

Figures

Figure 1
Figure 1
Neuron-specific knockdown of E93 increases body weight and energy stores. A: Body weights of (3-day old) of males and females of nSyb>E93RNAi are increased compared to all RNAi only controls (none>E93RNAi and none>mCherryRNAi) and the GAL4 driver control (nSyb>mCherryRNAi). Each data point represents one group of 5 flies. The bars indicate the mean ± S.E.M. ∗∗∗p < 0.001 by two-way ANOVA. B: Representative images of males (♂) and females (♀) of control (nSyb>mCherryRNAi) and nSyb>E93RNAi flies. Scale bar = 1 mm. C–D: Time-course of body weight measurements in males (C) and females (D) showing a slight (male) or no (female) difference in initial body weights compared to controls (none>E93RNAi). Body weights gradually increase in nSyb>E93RNAi flies compared to controls. Errors are S.E.M. ∗∗∗p < 0.001 by Student t-test. E: Triglyceride (TAG) levels are increased in nSyb>E93RNAi males but not in nSyb>E93RNAi females when compared to controls (nSyb>mCherryRNAi). F: Glycogen levels are increased in nSyb>E93RNAi females but not in nSyb>E93RNAi males when compared to controls (nSyb>mCherryRNAi). E–F: Each data point represents one group of 5 males or one group of 2–5 females. The bars indicate the mean ± S.E.M. ∗p < 0.05, ∗∗p < 0.005, ns = not significant by Student t-test.
Figure 2
Figure 2
Neuron-specific knockdown of E93 increases feeding frequency, food intake, and starvation survival. A–B:nSyb>E93RNAi flies are more attracted to food (A) and show a higher feeding frequency than the control (nSyb>mCherryRNAi) (B). Each data point represents one experiment of 9–16 flies. The bars indicate the mean ± S.E.M. C:nSyb>E93RNAi flies constantly feed as indirectly measured by % of flies with extended proboscis. N = 144–187 males, 83–100 females. D: Representative images of proboscises in each state of closed, half-open, and fully open. Scale bar = 100 μm. E: The % unexpanded wings in nSyb>E93RNAi flies. N = 82 males, 113 females. F:nSyb>E93RNAi flies have increased food intake. After 10 min of feeding, the flies were homogenized, and the food intake was measured by absorbance of the blue dye at 630 λ. none>E93RNAi flies were used as controls. Each data point represents one sample. The bars indicate the mean ± S.E.M. G–H: Both males (G) and females (H) of nSyb>E93RNAi survive starvation better than all three controls. B, F: ∗∗p < 0.005, ∗∗∗p < 0.001, ns = not significant by Student t-test. G, H: ∗∗∗p < 0.001 by log-rank test.
Figure 3
Figure 3
Loss of E93 in GABA-ergicand MIP neurons underliesmetabolic changes. A–C:vGAT>E93RNAi flies phenocopies nSyb>E93RNAi flies with increased body weight (A), obese appearance (B), and increased feeding frequency (C). vGAT>mCherryRNAi was used as controls. A: Each data point represents one group of 5 flies. C: Each data point represents one experiment of 9–16 flies. The bars indicate the mean ± S.E.M. B: Scale bar = 1 mm. D–F:MIP>E93RNAi phenocopies nSyb>E93RNAi with increased body weight (D), obese appearance (E), and increased feeding frequency (F). MIP>mCherryRNAi flies were used as controls. D: Each data point represents one group of 5 flies. F: Each data point represents one experiment of 9–16 flies. The bars indicate the mean ± S.E.M. ∗p < 0.05, ∗∗p < 0.005, ∗∗∗p < 0.001 by Student t-test. G–H:MIP>GAL80 partially but significantly reverses the increased body weight phenotype of nSyb>E93RNAi. Each data point represents one group of 5 flies. The bars indicate the mean ± S.E.M. ∗∗p < 0.005, ∗∗∗p < 0.001 by Two-way ANOVA. H: Scale bar = 1 mm. I:MIP>EcRRNAi phenocopies MIP>E93RNAi with increased body weight. MIP>mCherryRNAi flies were used as controls. Each data point represents one group of 5 flies. The bars indicate the mean ± S.E.M. ∗∗∗p < 0.001 by Student t-test.
Figure 4
Figure 4
Reduced E93 expression in neurons decreases endurance and climbing speed in adult flies. A: Pan-neuronal knockdown of E93 significantly reduced endurance and climbing speed in nSyb>E93RNAi male and female flies. B: GABAergic neuron-specific knockdown of E93 significantly reduced endurance and climbing speed in vGAT>E93RNAi male and female flies. C: MIP neuron-specific knockdown of E93 significantly reduced endurance and climbing speed in MIP>E93RNAi male and female flies. All controls were generated by crossing the genetic background of the GAL4 line with E93RNAi (none>E93RNAi). ∗∗∗p < 0.001, ∗∗∗∗p < 0.0001, by two-way ANOVA with post-hoc Tukey's multiple comparisons test.
Figure 5
Figure 5
Reduced E93 expression in neurons attenuates morning and evening circadian anticipation. Beam breaks were recorded every 6 min from individual fly using the DAM assay system under 12 h light and 12 h dark conditions. Group average double-plotted actograms were generated with 30 min bins and plotted scale 0–120 counts/30 min. The x-axis indicates Zeitgeber time and y-axis indicates days. Control (mCherry RNAi; left) and E93 or EcR knockdown (right) flies are plotted by sex (males (♂): top, females (♀): bottom). White background indicates light phase and gray background indicates dark phase. A: Pan-neuronal knockdown of E93 expression using the nSyb-GAL4 driver. nSyb>mCherryRNAi males (N = 27, 2 cohorts), nSyb>mCherryRNAi females (N = 29, 2 cohorts), nSyb>E93RNAi males (N = 31, 2 cohorts), and nSyb>E93RNAi females (N = 31, 2 cohorts). B: Knockdown of E93 expression in GABA-ergic neurons. vGAT>mCherryRNAi males (N = 39, 3 cohorts), vGAT>mCherryRNAi females (N = 73, 5 cohorts), vGAT>E93RNAi males (N = 45, 3 cohorts), and vGAT>E93RNAi females (N = 64, 5 cohorts). C: Knockdown of E93 expression in MIP neurons. MIP>mCherryRNAi males (N = 31, 2 cohorts), MIP>mCherryRNAi females (N = 32 2 cohorts), MIP>E93RNAi males (N = 32, 2 cohorts), and MIP>E93RNAi females (N = 32, 2 cohorts). D: Knockdown of EcR expression in MIP neurons. MIP>mCherryRNAi males (N = 32, 2 cohorts), MIP>mCherryRNAi females (N = 28, 2 cohorts), MIP>EcRRNAi males (N = 30, 2 cohorts), and MIP>EcRRNAi females (N = 32, 2 cohorts).
Figure 6
Figure 6
Reduced E93 expression in neurons disrupts circadian rhythm. Group average double-plotted actograms of flies in constant darkness are shown. Flies raised in 12 h light and 12 h dark condition were placed in DAM system during the light phase and released in constant darkness at the time of lights off. The white box indicates the last light cycle before releasing flies in constant darkness. A: Pan-neuronal knockdown of E93 expression using the nSyb-GAL4 driver. nSyb>mCherryRNAi males (N = 45, 3 cohorts), nSyb>mCherryRNAi females (N = 46, 3 cohorts), nSyb>E93RNAi males (N = 59, 4 cohorts), and nSyb>E93RNAi females (N = 61, 4 cohorts). B: Knockdown of E93 expression in GABA-ergic neurons. vGAT>mCherryRNAi males (N = 26, 2 cohorts), vGAT>mCherryRNAi females (N = 39, 3 cohorts), vGAT>E93RNAi males (N = 31, 2 cohorts), and vGAT>E93RNAi females (N = 44, 3 cohorts). C: Knockdown of E93 expression in MIP neurons. MIP>mCherryRNAi males (N = 31, 2 cohorts), MIP>mCherryRNAi females (N = 31 2 cohorts), MIP>E93RNAi males (N = 32, 2 cohorts), and MIP>E93RNAi females (N = 31, 2 cohorts). D: Knockdown of EcR expression in MIP neurons. MIP>mCherryRNAi males (N = 31, 2 cohorts), MIP>mCherryRNAi females (N = 31, 2 cohorts), MIP>EcRRNAi males (N = 30, 2 cohorts), and MIP>EcRRNAi females (N = 32, 2 cohorts). Other conditions are the same as the actograms in Figure 5.
Figure 7
Figure 7
E93 function is critical during larval-to-adult transition. A: The body weights are not different between tubP-GAL80ts; nSybGAL4>E93RNAi flies (shown as GAL80ts:nSyb>E93RNAi) and tubP-GAL80ts; nSybGAL4>mCherryRNAi (shown as GAL80ts:nSyb>mCherryRNAi) flies when both were raised at constant 19 °C, a permissive temperature, throughout life. B:tubP-GAL80ts; nSybGAL4>E93RNAi flies are heavier than tubP-GAL80ts; nSybGAL4>mCherryRNAi flies when both were raised at constant 30 °C, a non-permissive temperature, throughout life. C: The body weights are not different between tubP-GAL80ts; nSybGAL4>E93RNAi flies and tubP-GAL80ts; nSybGAL4>mCherryRNAi flies when both were raised at 19 °C and then moved to 30 °C immediately after eclosion. D:tubP-GAL80ts; nSybGAL4>E93RNAi flies are heavier than tubP-GAL80ts; nSybGAL4>E93RNAi flies when both were raised at 30 °C and then moved to 19 °C immediately after eclosion. E:tubP-GAL80ts; nSybGAL4>E93RNAi flies are heavier than tubP-GAL80ts; nSybGAL4>mCherryRNAi flies when both were raised at 19 °C and then moved to 30 °C at the L3 stage. F: The body weights are not different between tubP-GAL80ts; nSybGAL4>E93RNAi flies and tubP-GAL80ts; nSybGAL4>mCherryRNAi flies when both were raised at 30 °C and then moved to 19 °C at the L3 stage. A–F: Each data point represents one group of 7–10 flies. Flies were 3–8 days old. The bars indicate the mean ± S.E.M. ns: not significant, ∗∗∗p < 0.001 by Student t-test.
Figure 8
Figure 8
Reduced E93 expression in neurons reduces reproductive behavior. A–C: The number of exhibition of mating behavior of males in the presence of food (see the Methods and Supplementary videos). A:nSyb>mCherryRNAi males (control) and nSyb>E93RNAi, N = 12 for both. 3–5 days old. B:vGAT>mCherryRNAi males (control) N = 9, and vGAT>E93RNAi males N = 8. 2–3 days old. C:MIP>mCherryRNAi males (control) and MIP>E93RNAi. N = 7 for both. 3 days old. Each data point represents a single male's behavior. D–F: The number of exhibition of mating behavior in the absence of food. D: nSyb>mCherryRNAi (control) and nSyb>E93RNAi, N = 9 for both. 2–3 days old. E: vGAT>mCherryRNAi (control) N = 26, and vGAT>E93RNAi N = 28. 3–5 days old. F: MIP>mCherryRNAi (control) and MIP>E93RNAi N = 16 for both. 3 days old. The bars indicate the mean ± S.E.M. ∗∗p < 0.01, ∗∗∗∗p < 0.0001 by Student t-test. G: Model A larva and an adult have distinct goals of growth and reproduction, respectively. This difference in goals directs the behavior and activity of each form to maximize fitness. Larvae's main activity is feeding to increase the mass, whereas the adults' is coordinated behavior such as circadian rhythmicity, optimum fitness, and energy stores for mating success. Our study suggests that E93 in GABA-ergic neurons and MIP-producing neurons acts as a switch critical for this transition.

References

    1. Tennessen J.M., Baker K.D., Lam G., Evans J., Thummel C.S. The Drosophila estrogen-related receptor directs a metabolic switch that supports developmental growth. Cell Metab. 2011;13(2):139–148. - PMC - PubMed
    1. Tennessen J.M., Bertagnolli N.M., Evans J., Sieber M.H., Cox J., Thummel C.S. Coordinated metabolic transitions during Drosophila embryogenesis and the onset of aerobic glycolysis. G3 (Bethesda) 2014;4(5):839–850. - PMC - PubMed
    1. Li H., Rai M., Buddika K., Sterrett M.C., Luhur A., Mahmoudzadeh N.H., et al. Lactate dehydrogenase and glycerol-3-phosphate dehydrogenase cooperatively regulate growth and carbohydrate metabolism during Drosophila melanogaster larval development. Development. 2019;146(17) - PMC - PubMed
    1. Covell C.V. Peterson Field Guides: Eastern Moths. Houghton Mifflin Company; 1984. p. 49.
    1. Tennessen J.M., Thummel C.S. Coordinating growth and maturation - insights from Drosophila. Curr Biol. 2011;21(18):R750–R757. - PMC - PubMed

MeSH terms

LinkOut - more resources