Kidney Energetics and Cyst Burden in Autosomal Dominant Polycystic Kidney Disease: A Pilot Study
- PMID: 38621633
- PMCID: PMC11344681
- DOI: 10.1053/j.ajkd.2024.02.016
Kidney Energetics and Cyst Burden in Autosomal Dominant Polycystic Kidney Disease: A Pilot Study
Abstract
Rationale & objective: In this pilot study, we hypothesized that autosomal dominant polycystic kidney disease (ADPKD) is characterized by impaired kidney oxidative metabolism that associates with kidney size and cyst burden.
Study design: Cross-sectional study.
Setting & participants: Twenty adults with ADPKD (age, 31±6 years; 65% women; body mass index [BMI], 26.8 [22.7-30.4] kg/m2; estimated glomerular filtration rate [eGFR, 2021 CKD-EPI creatinine], 103±18mL/min/1.73m2; height-adjusted total kidney volume [HTKV], 731±370mL/m; Mayo classifications 1B [5%], 1C [42%], 1D [21%], and 1E [32%]) and 11 controls in normal weight category (NWC) (age, 25±3 years; 45% women; BMI, 22.5 [21.7-24.2] kg/m2; eGFR, 113±15mL/min/1.73m2; HTKV, 159±31mL/m) at the University of Colorado Anschutz Medical Campus.
Predictors: ADPKD status (yes/no) and severity (Mayo classifications).
Outcome: HTKV and cyst burden by magnetic resonance imaging, kidney oxidative metabolism, and perfusion by 11C-acetate positron emission tomography/computed tomography, insulin sensitivity by hyperinsulinemic-euglycemic clamps (presented as ratio of M-value of steady state insulin concentration [M/I]).
Analytical approach: For categorical variables, χ2/Fisher's exact tests, and for continuous variables t tests/Mann-Whitney U tests. Pearson correlation was used to estimate the relationships between variables.
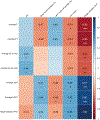
Results: Compared with NWC individuals, the participants with ADPKD exhibited lower mean±SD M/I ratio (0.586±0.205 vs 0.424±0.171 [mg/kg lean/min]/(μIU/mL), P=0.04), lower median cortical perfusion (1.93 [IQR, 1.80-2.09] vs 0.68 [IQR, 0.47-1.04] mL/min/g, P<0.001) and lower median total kidney oxidative metabolism (0.17 [IQR, 0.16-0.19] vs. 0.14 [IQR, 0.12-0.15] min-1, P=0.001) in voxel-wise models excluding cysts. HTKV correlated inversely with cortical perfusion (r: -0.83, P < 0.001), total kidney oxidative metabolism (r: -0.61, P<0.001) and M/I (r: -0.41, P = 0.03).
Limitations: Small sample size and cross-sectional design.
Conclusions: Adults with ADPKD and preserved kidney function exhibited impaired renal perfusion and kidney oxidative metabolism across a wide range of cysts and kidney enlargements.
Funding: Grants from government (National Institutes of Health, Centers for Disease Control and Prevention) and not-for-profit (JDRF) entities.
Trial registration: Registered at ClinicalTrials.gov with study numbers NCT04407481 and NCT04074668.
Plain-language summary: In our study, we explored how a common genetic kidney condition, autosomal dominant polycystic kidney disease (ADPKD), relates to kidney metabolism. ADPKD leads to the growth of numerous cysts in the kidneys, which can impact their ability to work properly. We wanted to understand the kidneys' ability to process oxygen and blood flow in ADPKD. Our approach involved using advanced imaging techniques to observe kidney metabolism and blood flow in people with ADPKD compared with healthy individuals. We discovered that those with ADPKD had significant changes in kidney oxygen metabolism even when their kidney function was still normal. These findings are crucial as they provide deeper insights into ADPKD, potentially guiding future treatments to target these changes.
Keywords: Hyperinsulinemic-euglycemic clamps; kidney MRI; kidney PET; polycystic kidney disease.
Copyright © 2024 National Kidney Foundation, Inc. Published by Elsevier Inc. All rights reserved.
Conflict of interest statement
Figures


References
-
- Iglesias CG, Torres VE, Offord KP, Holley KE, Beard CM, Kurland LT. Epidemiology of adult polycystic kidney disease, Olmsted County, Minnesota: 1935–1980. Am J Kidney Dis. May 1983;2(6):630–9. - PubMed
MeSH terms
Associated data
Grants and funding
LinkOut - more resources
Full Text Sources
Medical
Research Materials
Miscellaneous

