. 2024 Apr 15;12(4):e008334.
doi: 10.1136/jitc-2023-008334.

Tetracyclines enhance antitumor T-cell immunity via the Zap70 signaling pathway

Affiliations

Tetracyclines enhance antitumor T-cell immunity via the Zap70 signaling pathway

Mari Tone et al. J Immunother Cancer. .

Abstract

Background: Cancer immunotherapy including immune checkpoint inhibitors is only effective for a limited population of patients with cancer. Therefore, the development of novel cancer immunotherapy is anticipated. In preliminary studies, we demonstrated that tetracyclines enhanced T-cell responses. Therefore, we herein investigated the efficacy of tetracyclines on antitumor T-cell responses by human peripheral T cells, murine models, and the lung tumor tissues of patients with non-small cell lung cancer (NSCLC), with a focus on signaling pathways in T cells.

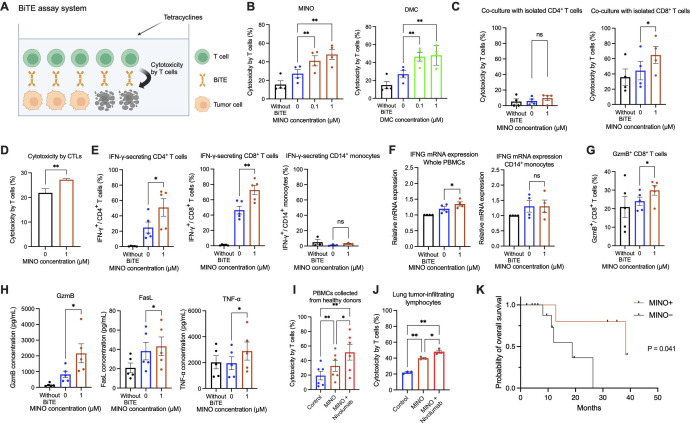
Methods: The cytotoxicity of peripheral and lung tumor-infiltrated human T cells against tumor cells was assessed by using bispecific T-cell engager (BiTE) technology (BiTE-assay system). The effects of tetracyclines on T cells in the peripheral blood of healthy donors and the tumor tissues of patients with NSCLC were examined using the BiTE-assay system in comparison with anti-programmed cell death-1 (PD-1) antibody, nivolumab. T-cell signaling molecules were analyzed by flow cytometry, ELISA, and qRT-PCR. To investigate the in vivo antitumor effects of tetracyclines, tetracyclines were administered orally to BALB/c mice engrafted with murine tumor cell lines, either in the presence or absence of anti-mouse CD8 inhibitors.

Results: The results obtained revealed that tetracyclines enhanced antitumor T-cell cytotoxicity with the upregulation of granzyme B and increased secretion of interferon-γ in human peripheral T cells and the lung tumor tissues of patients with NSCLC. The analysis of T-cell signaling showed that CD69 in both CD4+ and CD8+ T cells was upregulated by minocycline. Downstream of T-cell receptor signaling, Zap70 phosphorylation and Nur77 were also upregulated by minocycline in the early phase after T-cell activation. These changes were not observed in T cells treated with anti-PD-1 antibodies under the same conditions. The administration of tetracyclines exhibited antitumor efficacy with the upregulation of CD69 and increases in tumor antigen-specific T cells in murine tumor models. These changes were canceled by the administration of anti-mouse CD8 inhibitors.

Conclusions: In conclusion, tetracyclines enhanced antitumor T-cell immunity via Zap70 signaling. These results will contribute to the development of novel cancer immunotherapy.

Keywords: Drug Evaluation, Preclinical; Non-Small Cell Lung Cancer; T-Lymphocytes.


Conflict of interest statement

Competing interests: There are no competing interests.

Figures

Figure 1
Figure 1. T-cell cytotoxicity against tumor cells enhanced by tetracyclines in vitro. (A) The BiTE-assay system that measures T-cell cytotoxicity against tumor cells using BiTE. PBMCs or lung tumor-infiltrating cells (5×10⁴ cells per well of 96-well flat-bottomed cell culture plates) were co-cultured with U251 cells (1×10⁴ cells per well of 96-well flat-bottomed cell culture plates) and BiTE (100 ng/mL) with and without tetracyclines or nivolumab. The cytotoxicity of T cells against U251 cells was measured using the MTS assay. (B) The cytotoxicity of T cells enhanced by tetracyclines was measured by the MTS assay after a 48-hour co-culture in the BiTE-assay system using PBMCs from healthy donors (N=4). (C) The cytotoxicity of CD4+ or CD8+ T cells isolated by negative selection using the CD4+ or CD8+ T Cell Isolation Kit (Miltenyi Biotec) was measured by the MTS assay after a 48-hour co-culture with and without 1 µM of minocycline in the BiTE-assay system (N=4). CD4+ or CD8+ T cells were collected from healthy donors. (D) The human CTL-assay system that measures antigen-specific cytotoxic T-cell cytotoxicity against tumor cells. MART-1 tetramer-positive CD8+ T cells (2×10³ cells per well of 96-well flat-bottomed cell culture plates) were co-cultured with SK-MEL-5 cells (5×10³ cells per well of 96-well flat-bottomed cell culture plates) ±1 µM of minocycline for 48 hours. The cytotoxicity of CTLs against SK-MEL-5 cells was measured in triplicate using the MTS assay. (E) The percentage of IFN-γ-secreting CD4+, CD8+ T cells, or CD14+ monocytes with and without 1 µM of minocycline was measured by the IFN-γ secretion assay (Miltenyi Biotec) after a 72-hour co-culture of PBMCs in the BiTE-assay system (N=5 or 3). PBMCs used in the BiTE-assay system were collected from healthy donors. (F) IFN-γ (IFN-G) mRNA expression by PBMCs or CD14+ monocytes from healthy donors after a 6-hour co-culture of PBMCs with and without 1 µM of minocycline in the BiTE-assay system was assessed using qRT-PCR (N=4). CD14 + monocytes were isolated from PBMCs prior to the qRT-PCR analysis. Data were shown as a relative ratio against a control condition modified by β-actin. (G) The percentage of GzmB+ CD8+ T cells cultured in the BiTE-assay system for 72 hours with and without 1 µM of minocycline was measured by a flow cytometry analysis (N=5). PBMCs used in the BiTE-assay system were collected from healthy donors. (H) The concentrations of GzmB, FasL, and TNF-α in the supernatant of the BiTE-assay system co-cultured with and without 1 µM of minocycline for 48 hours (N=5). PBMCs used in the BiTE-assay system were collected from healthy donors. (I) The cytotoxicity of T cells enhanced by the combination of 1 µM of minocycline and 1 µg/mL of nivolumab was measured by the MTS assay after a 48-hour co-culture in the assay system with BiTE using PBMCs from healthy donors (N=6). (J) The cytotoxicity of T cells enhanced by the combination of 1 µM of minocycline and 1 µg/mL of nivolumab was measured by the MTS assay after a 72-hour co-culture in the assay system with BiTE using lung tumor-infiltrating cells collected from the surgically resected lung tumor tissues of patients with NSCLC (N=3). (K) Kaplan-Meier curves of the overall survival of patients with NSCLC treated with ICIs in groups that received minocycline (N=5) and did not (N=12) before the ICI treatment. Data are shown as the mean±SEM or the mean±SD. A one-way analysis of variance with Tukey’s post hoc test, a paired two-tailed Student’s t-test, or a two-tailed Student’s t-test was used to examine the significance of differences between samples (*p<0.05; **p<0.01; ***p<0.001; ****p<0.0001; ns, not significant). Overall survival curves were generated by the Kaplan-Meier method and compared using the log-rank test. BiTE, bispecific T-cell engager; CTL, cytotoxic T-lymphocyte; DMC, demeclocycline; FasL, Fas ligand; GzmB, granzyme B; ICI, immune checkpoint inhibitor; IFN-γ, interferon gamma; MART-1, melanoma antigen recognized by T cells-1; MINO, minocycline; mRNA, messenger RNA; MTS, 3-(4,5-dimethylthiazol-2-yl)−5-(3-carboxymethoxyphenyl)−2-(4-sulfophenyl)−2H-tetrazolium; NSCLC, non-small cell lung cancer; PBMCs, peripheral blood mononuclear cells; qRT-PCR, quantitative reverse transcription PCR; TNF-α, tumor necrosis factor-α.
Figure 2
Figure 2. Upregulation of CD69 by minocycline in human peripheral T cells. (A–D) A flow cytometry analysis of PBMCs from healthy donors after a 72-hour co-culture with and without 1 µM of minocycline or 1 µg/mL of nivolumab in the BiTE-assay system (N=4). (A) A FlowSOM clustering analysis was performed using the results of the flow cytometry analysis after gating CD3+ T cells. The result of one representative donor is shown. The percentage of clusters 1 and 5 to total CD3+ T cells is shown in bar graphs. (B) A heatmap showing selected marker expression in CD3+ T-cell clusters identified by FlowSOM. (C) A viSNE analysis was performed using the results of the flow cytometry analysis after gating CD3+ T cells. A representative viSNE plot of T cells colored by the expression levels of the selected markers is shown. (D) A CITRUS analysis was performed using the results of the flow cytometry analysis after gating CD3+ T cells. Clusters defined by the CITRUS analysis are depicted. Red-colored clusters showed cell subsets that had a significantly different abundance among the three groups (control, minocycline, and nivolumab). Clusters circled in yellow were abundant in the minocycline group. Histograms for selected markers in two representative clusters with significantly large differential expressions are shown. (E) The percentage of CD69+ CD4+ or CD8+ healthy-donor T cells cultured in the BiTE-assay system for 48 hours with and without 1 µM of minocycline or 1 µg/mL of nivolumab was measured by flow cytometry. The time course of changes in the percentage of CD69+ CD4+ or CD8+ T cells is also shown. (F) CD69 mRNA expression of PBMCs from healthy donors after a 6-hour co-culture with and without 1 µM of minocycline in the BiTE-assay system was assessed by qRT-PCR (N=3). Data are shown as a minocycline/control relative ratio modified by β-actin. (G) A flow cytometry analysis measured the percentage of CD69+ in isolated CD4+ or CD8+ T cells co-cultured with and without 1 µM of minocycline in the BiTE-assay system for 72 hours. Isolation was performed by negative selection using the CD4+ or CD8+ T Cell Isolation Kit (Miltenyi Biotec) (N=3). Data are shown as the mean±SEM. A one-way analysis of variance with Tukey’s post hoc test or a paired two-tailed Student’s t-test was used to examine the significance of differences between samples (*p<0.05; **p<0.01; ***p<0.001; ****p<0.0001; ns, not significant). BiTE, bispecific T cell engager; GzmB, granzyme B; MINO, minocycline; mRNA, messenger RNA; PBMC, peripheral blood mononuclear cells; PD-1, programmed cell death-1; qRT-PCR, quantitative reverse transcription PCR.
Figure 3
Figure 3. Upregulation of CD69 by minocycline in tumor-infiltrating T cells from surgically resected lung tumor tissues of patients with NSCLC. (A) Flow cytometry analysis of PBMCs from healthy donors or lung tumor-infiltrating cells from surgically resected lung tumor tissues before a co-culture in the BiTE-assay system (N=4). (B–D) Flow cytometry analysis of lung tumor-infiltrating cells collected from surgically resected lung cancer tissues of patients with NSCLC and co-cultured in the BiTE-assay system for 72 hours with and without 1 µM of minocycline (N=4). (B) A CITRUS analysis was performed using the results of the flow cytometry analysis on tumor-infiltrating CD3+ T cells. Clusters defined by the CITRUS analysis are depicted. Red-colored clusters show cell subsets that had a significantly different abundance among the control and minocycline groups. Clusters circled in yellow were abundant in the minocycline group. Histograms for selected markers in an identified cluster with significantly large differential expression are shown. (C) A flow cytometry analysis of the percentage of CD69+ CD4+ T cells or CD8+ T cells from the surgically resected lung tumor tissues of patients with NSCLC. (D) A flow cytometry analysis of the percentage of CD69+ GzmB+ CD8+ T cells from the surgically resected lung tumor tissues of patients with NSCLC. Data are shown as the mean±SEM. A paired two-tailed Student’s t-test was used to examine the significance of differences between samples (*p<0.05; **p<0.01; ***p<0.001; ****p<0.0001; ns, not significant). BiTE, bispecific T cell engager; GzmB, granzyme B; MINO, minocycline; NSCLC, non-small cell lung cancer; PBMCs, peripheral blood mononuclear cells; PD-1, programmed cell death-1; TIL, tumor-infiltrating lymphocyte.
Figure 4
Figure 4. Upregulation of TCR signal transduction by minocycline. (A) A schematic representation of TCR signal transduction is depicted. (B) The percentage of Nur77+ CD4+ or CD8+ T cells cultured in the BiTE-assay system for 48 hours with and without 1 µM of minocycline was measured by flow cytometry (N=4). The time course of changes in the percentage of CD69+ CD4+ or CD8+ T cells is also shown. PBMCs used in the BiTE-assay system were collected from healthy donors. (C) The percentage of pZap70+ CD4+ or CD8+ T cells cultured in the BiTE-assay system for 72 hours with and without 1 µM of minocycline was measured by flow cytometry (N=5). PBMCs used in the BiTE-assay system were collected from healthy donors. (D) PBMC lysates were measured by ELISA for Zap70 phosphorylation in PBMCs cultured in the BiTE-assay system for 5 min with and without 1 µM of minocycline (N=4). PBMCs used in the BiTE-assay system were collected from healthy donors. (E) Upregulated or downregulated gene pathways of GO biological process in the presence of minocycline were analyzed using bulk RNA-seq data. CD8+ T cells isolated from healthy donor PBMCs after a 6-hour co-culture in the presence and absence of 1 µM of minocycline in the BiTE-assay system were used for RNA-seq (N=3). The top 40 gene pathways with significant differential expression between minocycline and the control group are shown by a hierarchical clustering tree. Data are shown as the mean±SEM. A one-way analysis of variance with Tukey’s post hoc test or a paired two-tailed Student’s t-test was used to examine the significance of differences between samples (*p<0.05; **p<0.01; ***p<0.001; ****p<0.0001; ns, not significant). BiTE, bispecific T cell engager; GO, Gene Ontology; MHC, major histocompatibility complex; MINO, minocycline; PBMCs, peripheral blood mononuclear cells; pZap70, phosphorylated Zap70; RNA-seq, RNA sequencing; TCR, T-cell receptor; TNF, tumor necrosis factor.
Figure 5
Figure 5. Inhibitory effects of minocycline on galectin-1 in T-cell immunity. (A) The cytotoxicity of T cells enhanced by tetracyclines was measured by the MTS assay after a 48-hour co-culture in the BiTE-assay system using PBMCs from healthy donors (N=3). A co-culture was conducted under three conditions; (1) PBMCs and U251 cells were both co-cultured±1 µM of minocycline in the BiTE-assay system. (2) After U251 cells only were cultured±1 µM of minocycline for 3 hours, PBMCs and U251 cells were co-cultured in the BiTE-assay system without minocycline. (3) After PBMCs only were cultured±1 µM of minocycline for 3 hours, PBMCs and U251 cells were co-cultured in the BiTE-assay system without minocycline. (B) The percentage of CD69+ CD4+ or CD8+ healthy-donor T cells cultured in the BiTE-assay system for 48 hours±1 µM of minocycline was measured by flow cytometry (N=3). A co-culture was conducted under the same three conditions as in (A). (C) SPRM was conducted to demonstrate the binding of minocycline to galectin-1 on control or galectin-1 KO U251 cells. The green site shows the presence of tumor cells on measurement chips and the red site shows the binding reaction of minocycline to tumor cells. (D) The percentage of CD69+ Jurkat cells after a 24-hour co-culture of BiTE and galectin-1 knockout or control U251 cells±1 µM of minocycline was measured by flow cytometry. Each experiment was performed in triplicate. (E) The percentage of CD69+ T cells, GzmB+ CD8+ T cells, or Nur77+ T cells cultured on 1 µg/mL of an anti-human CD3 antibody-coated plate±1 µM of minocycline±1 µM of recombinant galectin-1 protein was measured by flow cytometry (N=5). PBMCs used in the recombinant galectin-1 protein assay system were collected from healthy donors. Data are shown as the mean±SEM or the mean±SD. A one-way analysis of variance with Tukey’s post hoc test, a paired two-tailed Student’s t-test, or a two-tailed Student’s t-test was used to examine the significance of differences between samples (*p<0.05; **p<0.01; ***p<0.001; ****p<0.0001; ns, not significant). BiTE, bispecific T cell engager; GzmB, granzyme B; KO, knock-out; MINO, minocycline; MTS, 3-(4,5-dimethylthiazol-2-yl)−5-(3-carboxymethoxyphenyl)−2-(4-sulfophenyl)−2H-tetrazolium; PBMCs, peripheral blood monocytes; SPRM, surface plasmon resonance microscopy; rGal-1, recombinant galectin-1 protein.
Figure 6
Figure 6. Antitumor effects of tetracyclines in murine models subcutaneously engrafted with murine tumor cell lines. (A) Between 1 and 30 mg/kg of tetracyclines was orally administered to BALB/c mice twice a day for 14 days from 5 days after the tumor inoculation. (B–D) Tumor growth curves from days 0 to 19 after the tumor inoculation (N=9–12). Demeclocycline was used in (B) and (D) and minocycline in (C). EMT6 was used in (B) and (C) and CT26 in (D). Data are shown as the mean±SEM. A two-tailed Student’s t-test was used to examine the significance of differences between the control group and each group (*p<0.05; **p<0.01; ***p<0.001; ****p<0.0001; ns, not significant). DMC, demeclocycline; MINO, minocycline.
Figure 7
Figure 7. In vivo antitumor T-cell immunity enhanced by demeclocycline. (A) A demeclocycline dose of 3 mg/kg was orally administered to BALB/c mice twice a day for 14 days from 5 days after the EMT6 inoculation with 400 µg of an anti-CD8 inhibitor or IgG2a isotype control antibody via an intraperitoneal injection 4 days after the tumor inoculation. Tumor growth curves from days 0 to 19 after the tumor inoculation are shown (N=9 or 10 per group). (B) (left) Antigen-specific gp70-tetramer+ peripheral CD3+ T cells in CT26-engrafted BALB/c mice treated with and without 3 mg/kg of demeclocycline twice daily for 14 days from 5 days after the tumor inoculation were analyzed by flow cytometry on day 19 after the tumor inoculation (N=6). (right) Antigen-specific gp70-tetramer+ tumor-infiltrating CD3+ T cells collected from CT26-engrafted BALB/c mice treated with and without 3 mg/kg of demeclocycline twice daily for 7 days from 5 days after the tumor inoculation were analyzed by flow cytometry on day 12 after the tumor inoculation (N=8). (C–D) Tumor-infiltrating cells collected from CT26-engrafted BALB/c mice treated with and without 3 mg/kg of demeclocycline twice daily for 7 days from 5 days after the tumor inoculation were analyzed by flow cytometry after a 4-hour PMA and ionomycin stimulation on day 12 after the tumor inoculation (N=8). (C) Tumor-infiltrating IFN-γ+ CD8+ T cells from CT26-engrafted BALB/c mice treated with and without 3 mg/kg of demeclocycline twice daily were analyzed by flow cytometry. (D) A CITRUS analysis was performed using the results of a flow cytometry analysis of tumor-infiltrating CD8+ T cells. Clusters defined by the CITRUS analysis are depicted. A red-colored cluster circled in yellow shows a cell subset that had a significantly high abundance in the demeclocycline group. Histograms for selected markers in the identified cluster with significantly large differential expressions are shown. (E) Tumor-infiltrating cells collected from CT26-engrafted BALB/c mice treated with and without 3 mg/kg of demeclocycline twice daily for 7 days from 5 days after the tumor inoculation were analyzed by flow cytometry without the PMA and ionomycin stimulation on day 12 after the tumor inoculation (N=8). A CITRUS analysis was performed using the results of the flow cytometry analysis of tumor-infiltrating CD8+ T cells. Clusters defined by the CITRUS analysis are depicted. Red-colored clusters show cell subsets that had a significantly different abundance among the control and demeclocycline groups. Clusters circled in yellow were abundant in the demeclocycline group. Histograms for selected markers in the identified clusters with significantly large differential expressions are shown. Data are shown as the mean±SEM. A two-tailed Student’s t-test was used to examine the significance of differences between samples (*p<0.05; **p<0.01; ***p<0.001; ****p<0.0001; ns, not significant). DMC, demeclocycline; IFN-γ, interferon-gamma; PBMC, peripheral blood mononuclear cells; PD-1, programmed cell death-1; PMA, phorbol 12-myristate 13-acetate; TIL, tumor-infiltrating lymphocyte; GzmB, granzyme B.

Similar articles

Cited by

References

    1. Garon EB, Rizvi NA, Hui R, et al. Pembrolizumab for the treatment of non-small-cell lung cancer. N Engl J Med. 2015;372:2018–28. doi: 10.1056/NEJMoa1501824. - DOI - PubMed
    1. Eikawa S, Nishida M, Mizukami S, et al. Immune-mediated antitumor effect by type 2 diabetes drug, metformin. Proc Natl Acad Sci U S A. 2015;112:1809–14. doi: 10.1073/pnas.1417636112. - DOI - PMC - PubMed
    1. Nishida M, Yamashita N, Ogawa T, et al. Mitochondrial reactive oxygen species trigger metformin-dependent antitumor immunity via activation of Nrf2/Mtorc1/P62 axis in tumor-infiltrating Cd8t lymphocytes. J Immunother Cancer. 2021;9:e002954. doi: 10.1136/jitc-2021-002954. - DOI - PMC - PubMed
    1. Chamoto K, Chowdhury PS, Kumar A, et al. Mitochondrial activation chemicals synergize with surface receptor PD-1 blockade for T cell-dependent antitumor activity. Proc Natl Acad Sci U S A. 2017;114:E761–70. doi: 10.1073/pnas.1620433114. - DOI - PMC - PubMed
    1. Chowdhury PS, Chamoto K, Kumar A, et al. PPAR-induced fatty acid oxidation in T cells increases the number of tumor-reactive Cd8. Cancer Immunol Res. 2018;6:1375–87. doi: 10.1158/2326-6066.CIR-18-0095. - DOI - PubMed