Bioinformatic Identification of Signaling Pathways and Hub Genes in Vascular Dementia
- PMID: 38622006
- PMCID: PMC11015743
- DOI: 10.62641/aep.v52i2.1601
Bioinformatic Identification of Signaling Pathways and Hub Genes in Vascular Dementia
Abstract
Background: Vascular dementia (VaD) is a prevalent neurodegenerative disease characterized by cognitive impairment due to cerebrovascular factors, affecting a significant portion of the aging population and highlighting the critical need to understand specific targets and mechanisms for effective prevention and treatment strategies. We aimed to identify pathways and crucial genes involved in the progression of VaD through bioinformatics analysis and subsequently validate these findings.
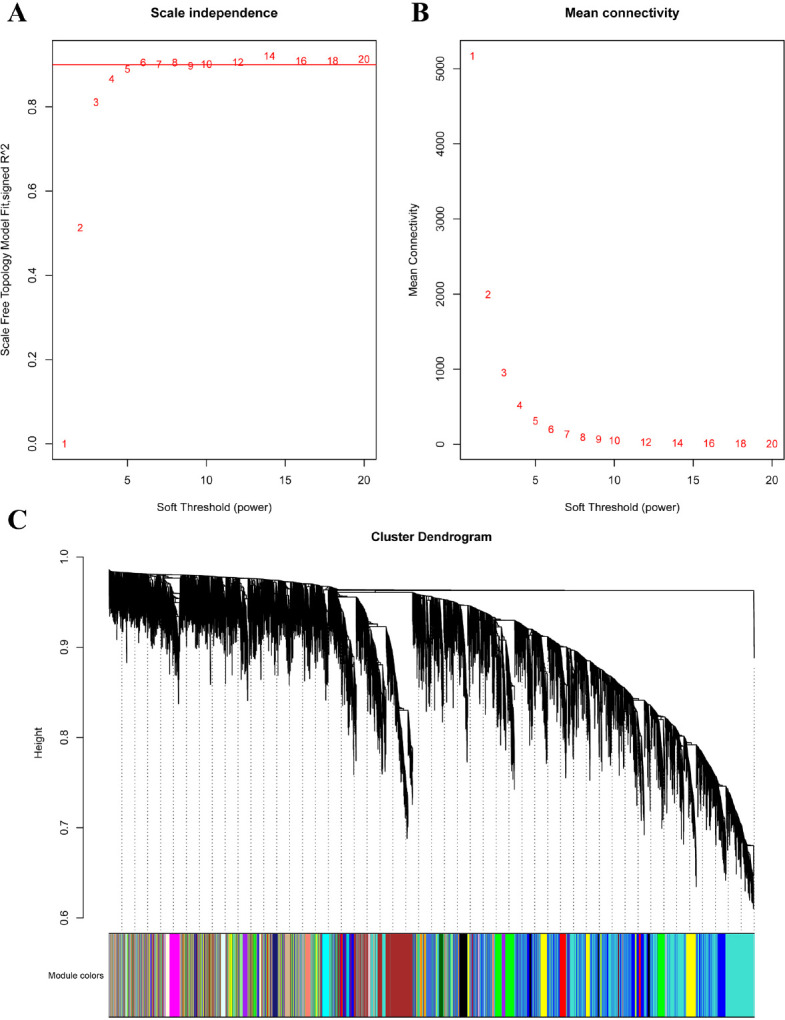
Methods: We conducted differential expression analysis, Weighted Gene Co-expression Network Analysis (WGCNA), Gene Ontology (GO), Kyoto Encyclopedia of Genes and Genomes (KEGG) pathway enrichment analysis, and Protein-Protein Interaction (PPI) analysis. We utilized pheochromocytoma 12 (PC12) cells to create an in vitro oxygen-glucose deprivation (OGD) model. We investigated the impact of overexpression and interference of adrenoceptor alpha 1D (ADRA1D) on OGD PC12 cells using TdT-mediated dUTP nick-end labeling (TUNEL), reverse transcription-quantitative polymerase chain reaction (RT-qPCR), western blot (WB), and Fluo-3-pentaacetoxymethyl ester (Fluo-3 AM) analysis.
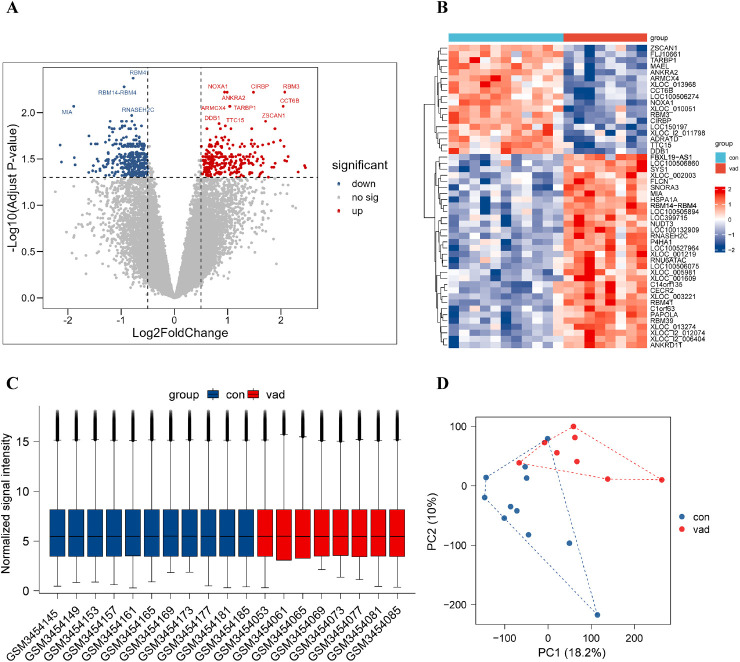
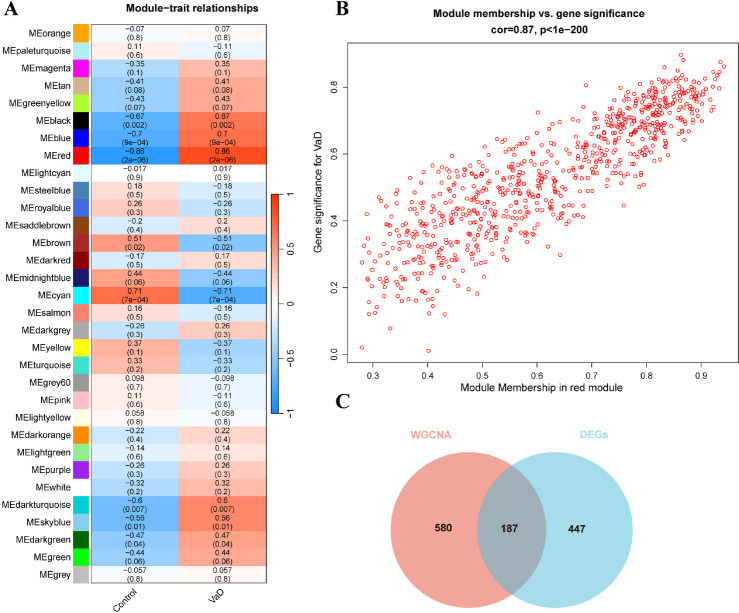
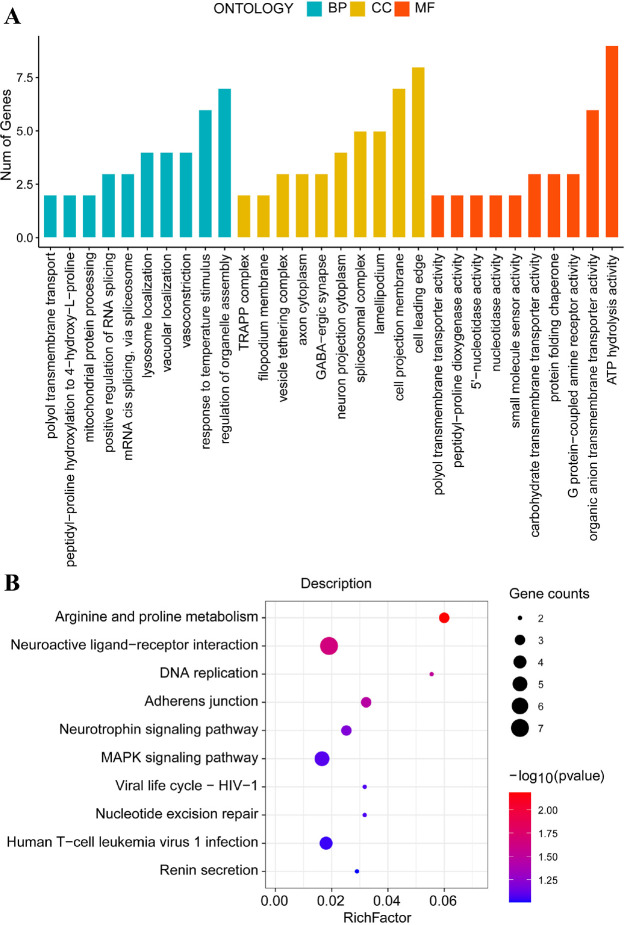
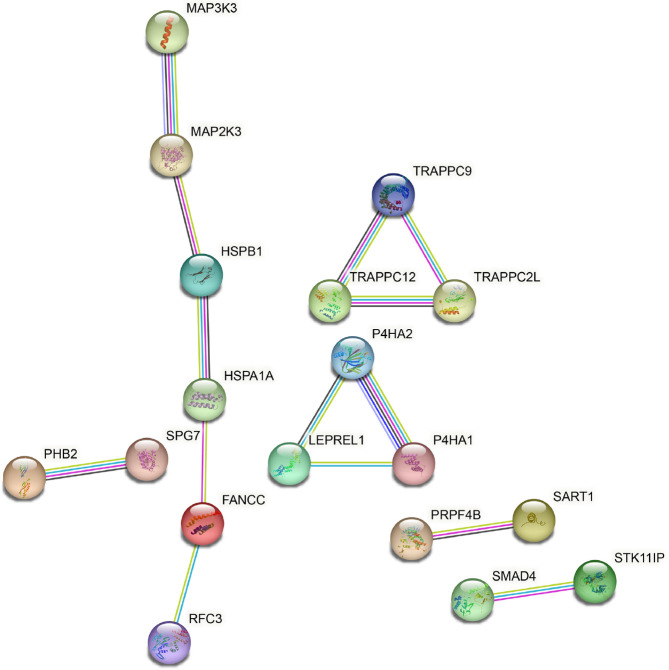
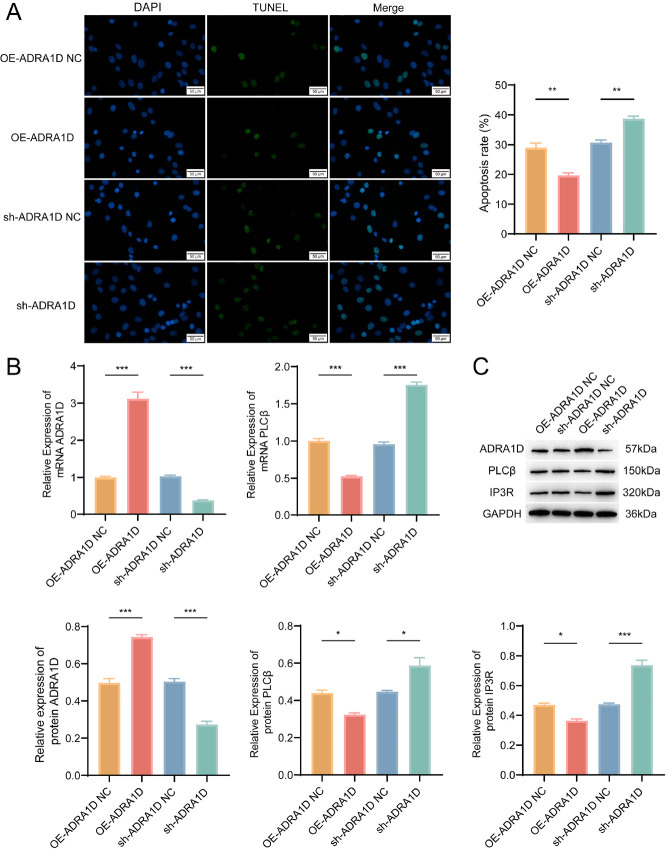
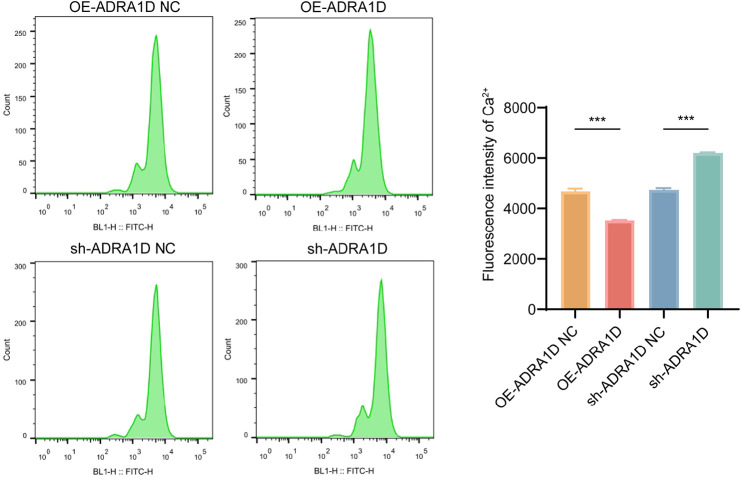
Results: We found 187 differentially expressed genes (DEGs) in the red module that were strongly associated with VaD and were primarily enriched in vasoconstriction, G protein-coupled amine receptor activity, and neuroactive ligand-receptor interaction, mitogen-activated protein kinase (MAPK) signaling pathway, and cell adhesion. Among these pathways, we identified ADRA1D as a gene shared by vasoconstriction, G protein-coupled amine receptor activity, and neuroactive ligand-receptor interaction. The TUNEL assay revealed a significant decrease in PC12 cell apoptosis with ADRA1D overexpression (p < 0.01) and a significant increase in apoptosis upon silencing ADRA1D (p < 0.01). RT-qPCR and WB analysis revealed elevated ADRA1D expression (p < 0.001) and decreased phospholipase C beta (PLCβ) and inositol 1,4,5-trisphosphate receptor (IP3R) expression (p < 0.05) with ADRA1D overexpression. Moreover, the Fluo-3 AM assessment indicated significantly lower intracellular Ca2+ levels with ADRA1D overexpression (p < 0.001). Conversely, interference with ADRA1D yielded opposite results.
Conclusion: Our study provides a new perspective on the pathogenic mechanisms of VaD and potential avenues for therapeutic intervention. The results highlight the role of ADRA1D in modulating cellular responses to OGD and VaD, suggesting its potential as a target for VaD treatment.
Conflict of interest statement
The authors declare no conflict of interest.
Figures
References
-
- Weidner W, Barbarino P. The State of the Art of Dementia Research: New Frontiers. Alzheimer’s & Dementia. 2019;15:P1473.
-
- Wolters FJ, Ikram MA. Epidemiology of Vascular Dementia. Arteriosclerosis, Thrombosis, and Vascular Biology. 2019;39:1542–1549. - PubMed
-
- Jia L, Quan M, Fu Y, Zhao T, Li Y, Wei C, et al. Dementia in China: epidemiology, clinical management, and research advances. The Lancet. Neurology. 2020;19:81–92. - PubMed
MeSH terms
Substances
LinkOut - more resources
Full Text Sources
Medical
Miscellaneous