. 2024 Apr 16;16(1):29.
doi: 10.1038/s41368-024-00292-1.

Single cell analysis unveils B cell-dominated immune subtypes in HNSCC for enhanced prognostic and therapeutic stratification

Affiliations

Single cell analysis unveils B cell-dominated immune subtypes in HNSCC for enhanced prognostic and therapeutic stratification

Kang Li et al. Int J Oral Sci. .

Abstract

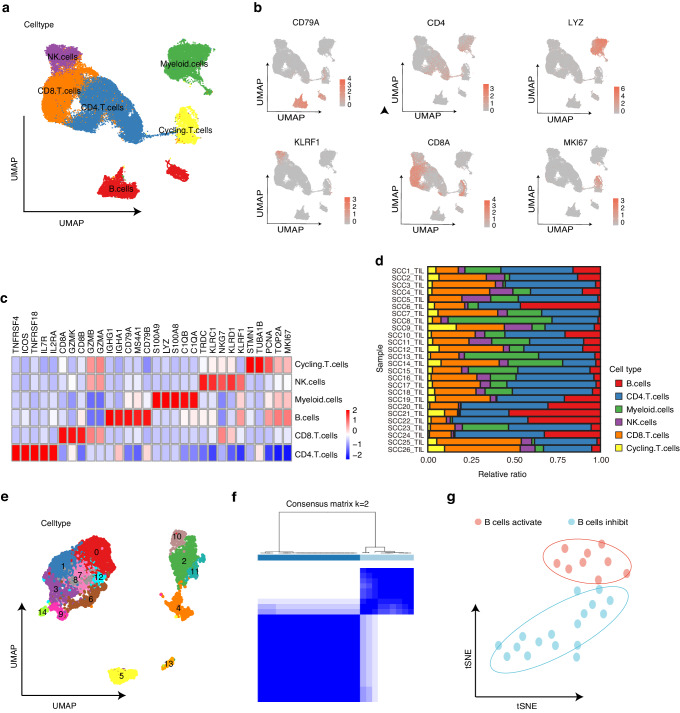
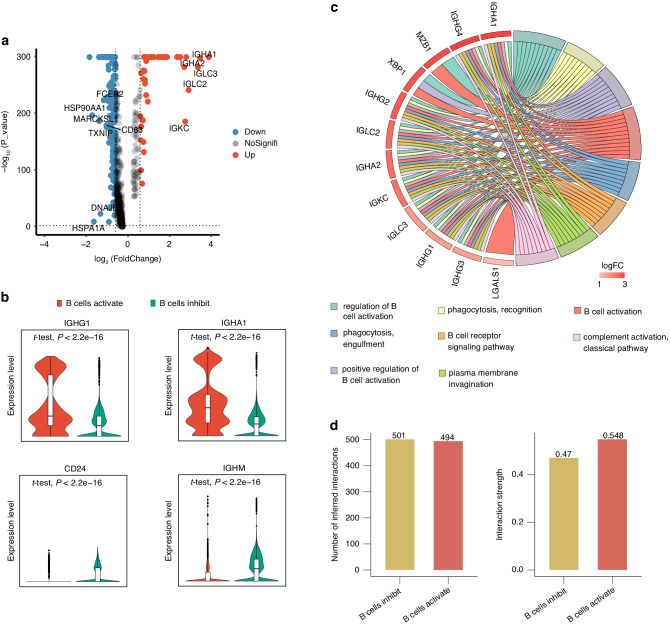
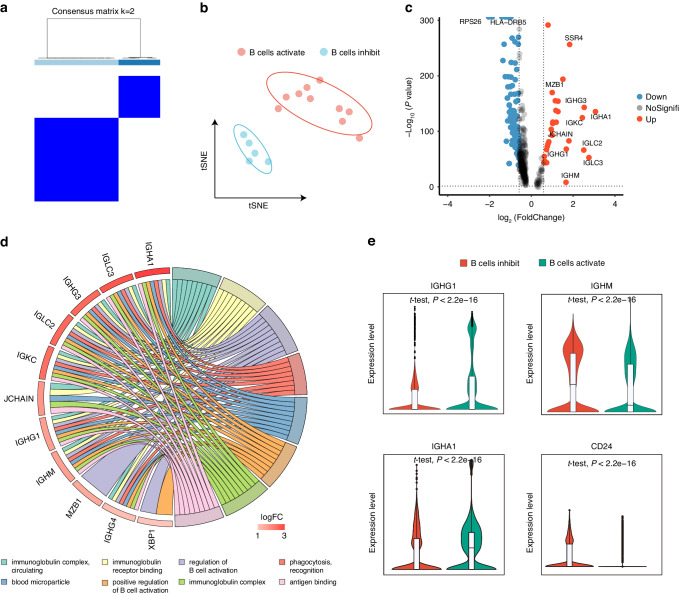
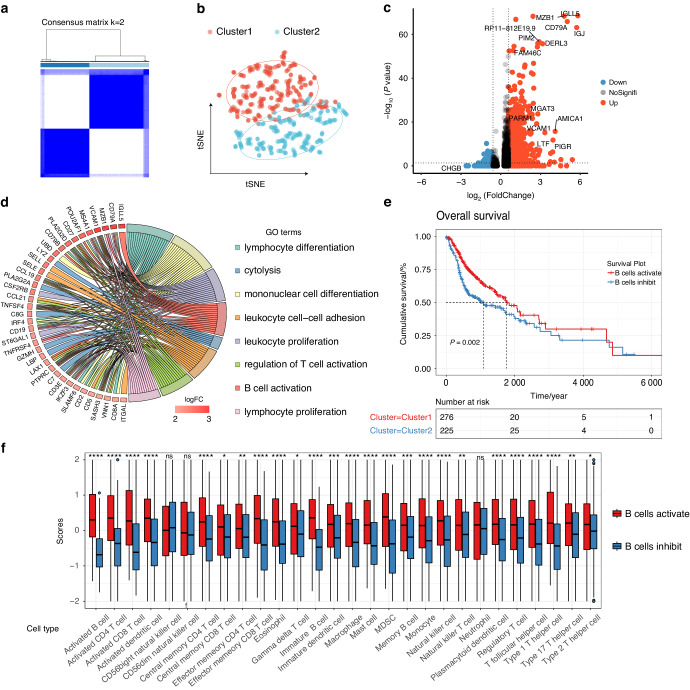
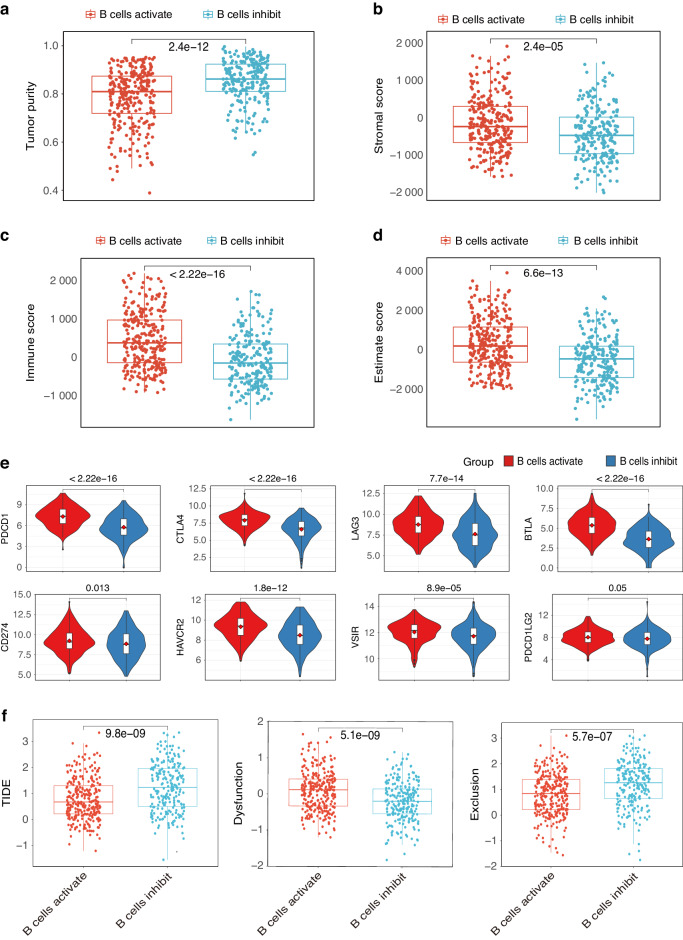
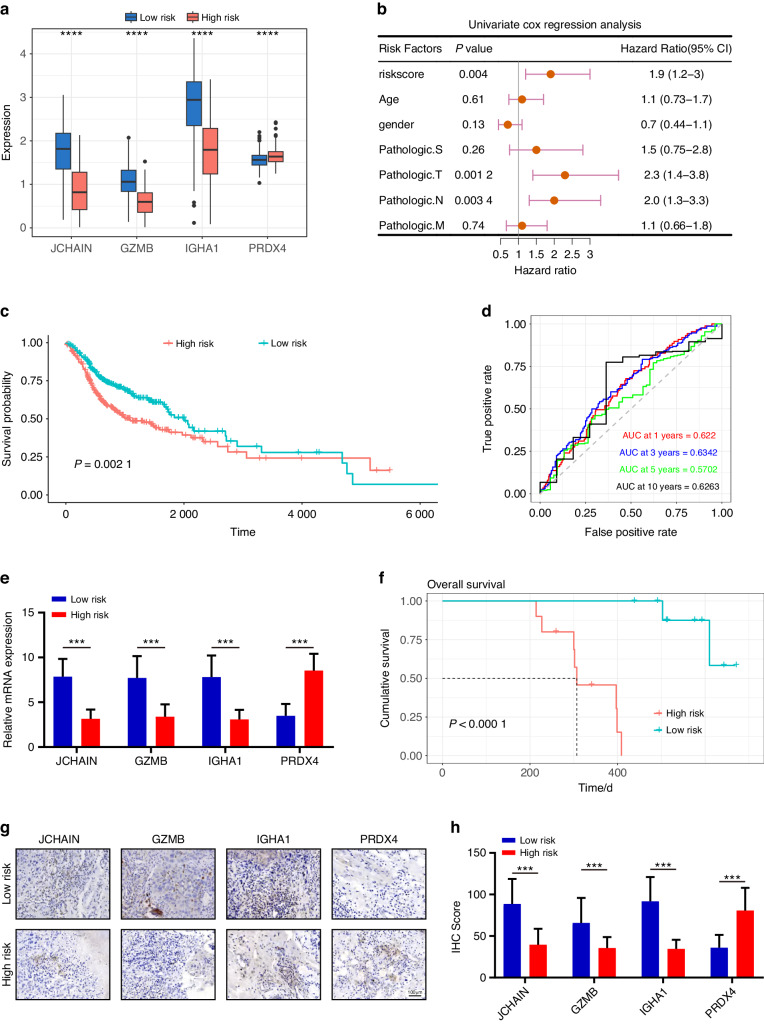
Head and neck squamous cell carcinoma (HNSCC) is characterized by high recurrence or distant metastases rate and the prognosis is challenging. There is mounting evidence that tumor-infiltrating B cells (TIL-Bs) have a crucial, synergistic role in tumor control. However, little is known about the role TIL-Bs play in immune microenvironment and the way TIL-Bs affect the outcome of immune checkpoint blockade. Using single-cell RNA sequencing (scRNA-seq) data from the Gene Expression Omnibus (GEO) database, the study identified distinct gene expression patterns in TIL-Bs. HNSCC samples were categorized into TIL-Bs inhibition and TIL-Bs activation groups using unsupervised clustering. This classification was further validated with TCGA HNSCC data, correlating with patient prognosis, immune cell infiltration, and response to immunotherapy. We found that the B cells activation group exhibited a better prognosis, higher immune cell infiltration, and distinct immune checkpoint levels, including elevated PD-L1. A prognostic model was also developed and validated, highlighting four genes as potential biomarkers for predicting survival outcomes in HNSCC patients. Overall, this study provides a foundational approach for B cells-based tumor classification in HNSCC, offering insights into targeted treatment and immunotherapy strategies.


Conflict of interest statement

The authors declare no competing interests.

Figures

Fig. 1
Fig. 1
Identification of immunological subtypes based on TIL-Bs by single cell analysis. a UMAP of tumor infiltrating immune cells (n = 105.943 cells) from 26 samples in HNSCC scRNA-seq, colored by cell clusters. b UMAP plots showing expression of classical marker genes from immune cell clusters. c Heatmap of signature genes for immune cell clusters. Each cell cluster is represented by five specifically expressed genes. d Bar plot showing the immune cell type proportion in each HNSCC sample. e UMAP plot showing 15 B cells clusters. f Two subgroups were identified using ConsensusClusterPlus R package based on the marker genes. g t-SNE plot of HNSCC scRNA-seq cohort (n = 26), colored by sample groups
Fig. 2
Fig. 2
Characterization of immunological subtypes based on TIL-Bs. a Volcano plot showing differentially expressed genes between B cells activation group and the B cells inhibition group B cells. Down, downregulated DEGs. NoSignifi, not significant. Up, upregulated DEGs. b Violin plot showing expression of IGHG1, IGHA1, CD24 and IGHM in B cells activation group and the B cells inhibition group. c GO cluster plot showing a chord dendrogram of the clustering of the expression spectrum of significantly upregulated genes in B cells based on the B-cell signature genes classification. d The differential number of interactions (left) or interaction strength (right) in the cell-cell communication network between the two groups was shown by the circle plots
Fig. 3
Fig. 3
Validation of classification method based on TIL-Bs in another dataset. a Two subgroups were identified using ConsensusClusterPlus R package based on the B-cell signature gene. b t-SNE plot of HNSCC scRNA-seq cohort (n = 15), colored by sample groups. c Volcano plot showing differentially expressed genes between B cells activation group and the B cells inhibition group B cells. Down, down regulated DEGs. NoSignifi, not significant. Up, up regulated DEGs. d GO cluster plot showing a chord dendrogram of the clustering of the expression spectrum of significantly upregulated genes in B cells based on the B-cell signature genes classification. e Violin plot showing expression of IGHG1, IGHA1, CD24 and IGHM in B cells activation group and the B cells inhibition group
Fig. 4
Fig. 4
Application of classification method based on TIL-Bs in TCGA cohort. a Consensus matrix of TCGA HNSCC cohort (n = 501). b t-SNE plot shows TCGA HNSCC samples were divided into two clusters. c Volcano plot depicts the differentially expressed genes between patients from cluster 1 and cluster 2. d GO cluster plot showing a chord dendrogram of the clustering of the expression spectrum of significantly upregulated genes in B cells activation group based on the B-cell signature genes classification. e The Kaplan-Meier overall survival curves of TCGA HNSCC patients between B cells activation group and the B cells inhibition group. TCGA samples were stratified by the B-cell signature genes. f The enrichment levels of 28 immune-related cells (by ssGSEA analysis) and types in the B cells activation group and B cells inhibition group
Fig. 5
Fig. 5
B cells-based classification predicts immunotherapy response accurately. Box plots showing lower tumor purity (a), and higher stromal score (b), immune score (c), and ESTIMATE score (d) in the B-cell activation group. e Box plots shows the different expression levels of the typical immune inhibitory receptors (PDCD1, CTLA4, LAG3, BTLA, CD274, HAVCR2, VSIR, and PDCD1LG2) between two groups. f Patients in the B cells activation group showed lower TIDE score, higher Dysfunction, and higher Exclusion score
Fig. 6
Fig. 6
Unveiling a four-gene risk model for prognostication in HNSCC patients. a Comparative boxplot delineating the modeling-related gene expression levels within the two groups. b Forest plot mapping out OS-related clinical factors via single-factor Cox regression analysis. c Kaplan–Meier survival plots manifesting prognosis-linked risk scores’ impact. d ROC curve spectra, a predictive gauge for 1, 3, 5, and 10-year OS dynamics. e Comparative analysis spotlighting differential gene expressions between high and low-risk groups. f Kaplan-Meier survival curves of HNSCC patients based on four genes Risk-scores. Representative IHC staining images (g) and IHC score (h) in the two groups. Scale bar, 100 μm

References

    1. Bray F, et al. Global cancer statistics 2018: GLOBOCAN estimates of incidence and mortality worldwide for 36 cancers in 185 countries. CA Cancer J. Clin. 2018;68:394–424. doi: 10.3322/caac.21492. - DOI - PubMed
    1. Chow LQM. Head and neck cancer. N. Engl. J. Med. 2020;382:60–72. doi: 10.1056/NEJMra1715715. - DOI - PubMed
    1. Mody MD, Rocco JW, Yom SS, Haddad RI, Saba NF. Head and neck cancer. Lancet. 2021;398:2289–2299. doi: 10.1016/S0140-6736(21)01550-6. - DOI - PubMed
    1. Szturz P, Vermorken JB. Management of recurrent and metastatic oral cavity cancer: Raising the bar a step higher. Oral. Oncol. 2020;101:104492. doi: 10.1016/j.oraloncology.2019.104492. - DOI - PubMed
    1. Adelstein D, et al. NCCN Guidelines Insights: Head and Neck Cancers, Version 2.2017. J. Natl Compr. Cancer Netw. 2017;15:761–770. doi: 10.6004/jnccn.2017.0101. - DOI - PubMed

Publication types