. 2024 Apr 15;15(1):3226.
doi: 10.1038/s41467-024-47185-9.

Microenvironmental reorganization in brain tumors following radiotherapy and recurrence revealed by hyperplexed immunofluorescence imaging

Collaborators, Affiliations

Microenvironmental reorganization in brain tumors following radiotherapy and recurrence revealed by hyperplexed immunofluorescence imaging

Spencer S Watson et al. Nat Commun. .

Abstract

The tumor microenvironment plays a crucial role in determining response to treatment. This involves a series of interconnected changes in the cellular landscape, spatial organization, and extracellular matrix composition. However, assessing these alterations simultaneously is challenging from a spatial perspective, due to the limitations of current high-dimensional imaging techniques and the extent of intratumoral heterogeneity over large lesion areas. In this study, we introduce a spatial proteomic workflow termed Hyperplexed Immunofluorescence Imaging (HIFI) that overcomes these limitations. HIFI allows for the simultaneous analysis of > 45 markers in fragile tissue sections at high magnification, using a cost-effective high-throughput workflow. We integrate HIFI with machine learning feature detection, graph-based network analysis, and cluster-based neighborhood analysis to analyze the microenvironment response to radiation therapy in a preclinical model of glioblastoma, and compare this response to a mouse model of breast-to-brain metastasis. Here we show that glioblastomas undergo extensive spatial reorganization of immune cell populations and structural architecture in response to treatment, while brain metastases show no comparable reorganization. Our integrated spatial analyses reveal highly divergent responses to radiation therapy between brain tumor models, despite equivalent radiotherapy benefit.


Conflict of interest statement

The authors declare no competing interests.

Figures

Fig. 1
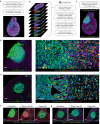
Fig. 1. Overview of Hyperplexed Immunofluorescence Imaging (HIFI) Workflow.
Experimental workflow of cyclic immunofluorescence staining, followed by image processing, alignment, and registration to create 45+ dimensional images across whole-slide sections. Specific domains within HIFI images of tumors were automatically annotated using trained machine-learning classifiers, and individual cells were segmented with deep-learning object detection. Single-cell objects were annotated as individual cell types with semi-supervised classification and mapped back onto images to create highly-annotated digital pathology images. Images were analyzed for regional cellular composition and spatial organizational analysis. The HIFI workflow is scalable to over 100 simultaneous sections for high-throughput spatial experiments.
Fig. 2
Fig. 2. Irradiation Treatment Sample Collection and Antibody Panel.
a PDGfp and BrM tumors were initiated in NTVA-Ink4a/Arf−/− and C57Bl6 mice respectively, and monitored by MRI. Experimental endpoints (red arrows) are indicated for each group. Biweekly MRI monitoring tracked the process of regression and recurrence for each mouse following IR for b, c PDGfp (n = 5 mice for each treatment group) and d, e BrM tumors (n = 3 mice for each treatment group. Upon tumor detection, mice were grouped into cohorts and collected as either (i) ‘untreated’ samples, (ii) treated with 10 Gy (PDGfp) or 15 Gy (BrM) focalized irradiation (IR) therapy and harvested 7 days post-IR, or (iii) treated with 10 or 15 Gy IR and harvested upon tumor regrowth. White arrows indicate the tumor in both tumor types, red arrows indicate post-IR lesion in PDGfp tumors. Source data are provided as a Source data file.
Fig. 3
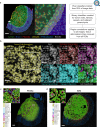
Fig. 3. HIFI Alignment.
a Image processing of raw image data consisted of tile stitching and flat-field correction, followed by rolling-ball background subtraction. Scale bar = 2 mm. b Panel depicts the repeated steps of the “HIFI Alignment” tool to align cyclic IF images while avoiding memory limitations and removing endogenous tissue autofluorescence. c Aligned and registered images were then merged into a single 45+ dimension whole-slide image. Images for d PDGfp and e BrM were cropped to encompass the entire tumor region and surrounding brain. Scale bars = 500 µm. Representative images of (f) PDGfp and (g) BrM samples from untreated, 7 days post-IR, and regrowth tumors. Scale bars = 400 µm.
Fig. 4
Fig. 4. Region Annotation, Cell Segmentation and Classification.
a Binary pixel classifiers were trained for multiple spatial regions (as indicated) in QuPath on a subset of image data. Tissue deformations and imaging errors were removed from regions of interest (ROIs) during quality control checks (white arrow indicates a representative example of a tissue tear). Scale bar = 500 µm. b Nuclei in murine glioblastoma samples were manually annotated to train StarDist nuclear detection models. Detection accuracy was compared to threshold-based watershed segmentation and the publicly available StarDist model for immunofluorescence (DSB_Heavy). Segmented nuclei were expanded by 2.5 µm to capture cell cytoplasm and classified by semi-supervised cell classification. Scale bars = 50 µm. Region annotation, cell segmentation, and cell classification were applied independently to all (c) PDGfp and (d) BrM HIFI images to generate fully annotated digital pathology images. Scale bars = 400 µm.
Fig. 5
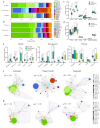
Fig. 5. Spatial analysis of IR-treated brain tumors.
Percentage of the total cellular composition quantified for each treatment group pooled across all images for (a) PDGfp and (b) BrM. Percentage of the area of tumor regions plotted for all groups for (c) PDGfp and (d) BrM. e Cell composition of tumor border, perivascular niches, and fibrotic regions for selected cell types in each treatment group. Box-plots for c-e show percent totals for each image (PDGfp Untreated n = 19 images, 7 days post-IR n = 17 images, Regrowth n = 18 images, BrM n = 9 images for each treatment). p values were calculated using two-way ANOVA test. p values for c (from left to right): <0.0001, <0.0001, <0.0001, <0.0001, 0.0002, <0.0001, 0.0067, 0.0045. p values for d (from left to right): 0.0023, 0.0317, 0.0044. p values for e (from left to right): Border, 0.0002, 0.0256, 0.0002, 0.0411, <0.0001, <0.0001, <0.0001, <0.0001, <0.0001, <0.0001, Perivascular < 0.0001, 0.0003, <0.0001, <0.0001, <0.0001, <0.0001, 0.001, 0.0094, <0.0001, <0.0001, Fibrosis, 0.014, <0.0001, <0.0001, 0.0486, <0.0001, <0.0001. Cell adjacency graph network plots of pooled treatment types and associated mean Shannon Diversity Index (μH’) for (f) PDGfp and (g) BrM microenvironments. Node sizes represent the binned range of percent-total cell populations, edge length is the mean distance between nearest neighbors, and edge width is the inverse standard deviation of mean distance. Gray outlines show clusters of nodes with similar neighbor relationships. Source data are provided as a Source data file.
Fig. 6
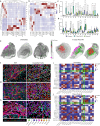
Fig. 6. Differential Reorganization Response to IR Between Brain Tumor Models.
Cellular composition column-scaled heatmaps of cell neighborhood (CN) analysis for (a) PDGfp and (b) BrM tumors. Percent total CNs across each treatment for (c) PDGfp and (d) BrM. Box-plots for c-d show percent totals for each image (PDGfp Untreated n = 19 images, 7 days post-IR n = 17 images, Regrowth n = 18 images, BrM n = 9 images for each treatment). p values were calculated using two-way ANOVA test. p values for c (from left to right): <0.0001, <0.0001, <0.0001, <0.0001, <0.0001, <0.0001, <0.0001, <0.0001, 0.0005, <0.0001, 0.0008, 0.0165, <0.0001, <0.0001, <0.0001, 0.0077, 0.0026, <0.0001, <0.0001, 0.008, <0.0001, <0.0001, 0.0116, 0.0003, <0.0001, <0.0001, <0.0001. p values for d (from left to right): 0.0013, 0.0014, 0.0003, 0.0008, 0.0122, 0.0471, 0.0006, 0.0079, 0.0003, 0.0027, 0.0004, 0.0052. e Representative positional plots for three untreated and three 7 days post-IR samples highlighting CNs 2, 5, and 14. fh Representative images from 7 days post-IR samples showing HIFI (left) and digital pathology (right) images of CN2, CN5, and CN14 respectively. Scale bars = 40 µm. Heatmaps of cellular colocalization calculated as the sum of two one-tailed permutation test p values (sum_sigval) for (i) untreated samples and (j) 7 days post-IR samples. Green boxes indicate significant colocalization and anticorrelation for Tumor_A cells, for example. Source data are provided as a Source data file.

References

    1. Grech N, et al. Rising Incidence of Glioblastoma Multiforme in a Well-Defined Population. Cureus. 2020;12:e8195. - PMC - PubMed
    1. Stupp R, et al. Radiotherapy plus concomitant and adjuvant temozolomide for glioblastoma. N. Engl. J. Med. 2005;352:987–996. doi: 10.1056/NEJMoa043330. - DOI - PubMed
    1. Stupp R, et al. Effects of radiotherapy with concomitant and adjuvant temozolomide versus radiotherapy alone on survival in glioblastoma in a randomised phase III study: 5-year analysis of the EORTC-NCIC trial. Lancet Oncol. 2009;10:459–466. doi: 10.1016/S1470-2045(09)70025-7. - DOI - PubMed
    1. Akkari, L. et al. Dynamic changes in glioma macrophage populations after radiotherapy reveal CSF-1R inhibition as a strategy to overcome resistance. Sci. Transl. Med.1210.1126/scitranslmed.aaw7843 (2020). - PubMed
    1. Croci D, et al. Multispectral fluorine-19 MRI enables longitudinal and noninvasive monitoring of tumor-associated macrophages. Sci. Transl. Med. 2022;14:eabo2952. doi: 10.1126/scitranslmed.abo2952. - DOI - PubMed