. 2024 Apr 15;10(1):175.
doi: 10.1038/s41420-024-01945-0.

Mcl-1 mediates intrinsic resistance to RAF inhibitors in mutant BRAF papillary thyroid carcinoma

Affiliations

Mcl-1 mediates intrinsic resistance to RAF inhibitors in mutant BRAF papillary thyroid carcinoma

Maria R Cavallo et al. Cell Death Discov. .

Abstract

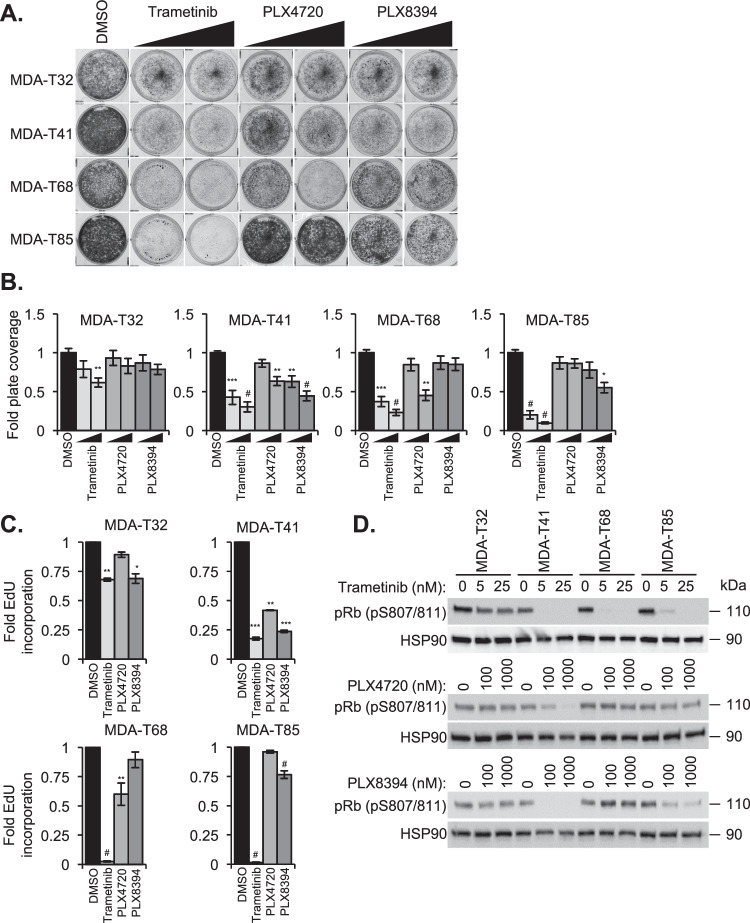
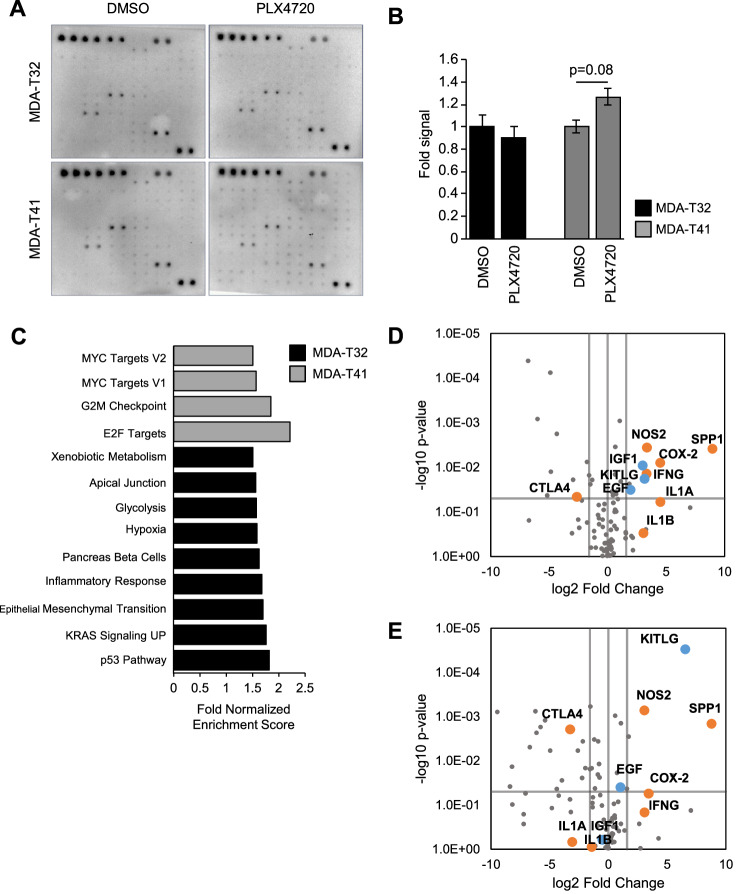
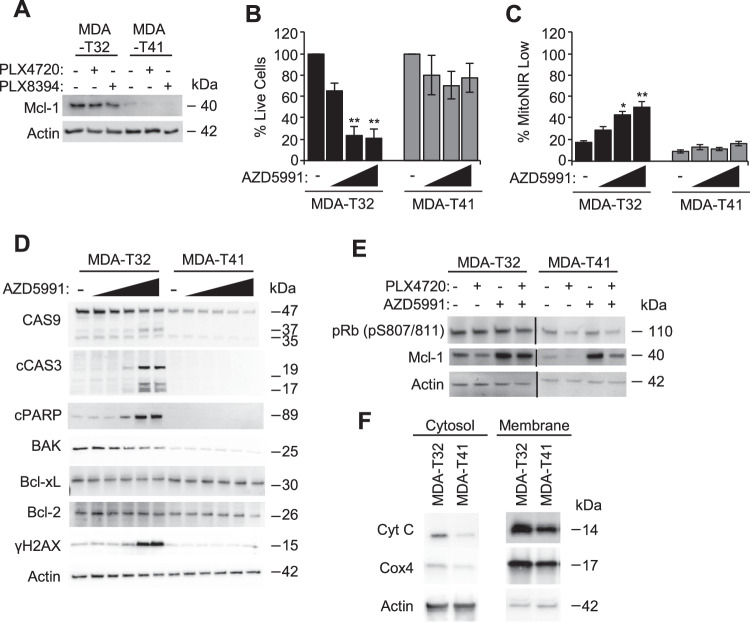
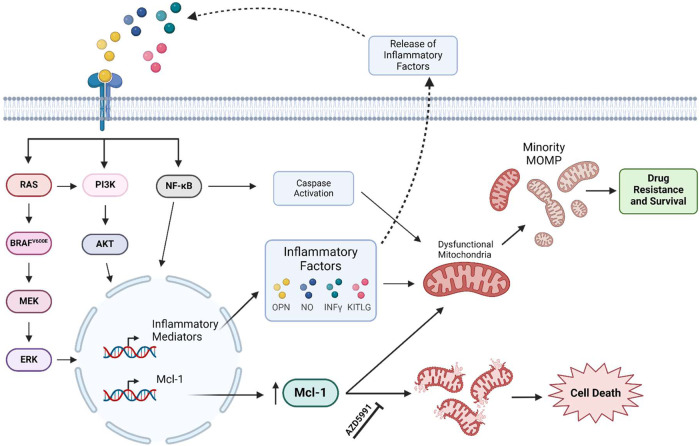
Papillary thyroid carcinoma (PTC) is the most frequent form of thyroid cancer. PTC commonly presents with mutations of the serine/threonine kinase BRAF (BRAFV600E), which drive ERK1/2 pathway activation to support growth and suppress apoptosis. PTC patients often undergo surgical resection; however, since the average age of PTC patients is under 50, adverse effects associated with prolonged maintenance therapy following total thyroidectomy are a concern. The development of mutant-selective BRAF inhibitors (BRAFi), like vemurafenib, has been efficacious in patients with metastatic melanoma, but the response rate is low for mutant BRAF PTC patients. Here, we assay the therapeutic response of BRAFi in a panel of human PTC cell lines and freshly biopsied patient samples. We observed heterogeneous responses to BRAFi, and multi-omic comparisons between susceptible and resistant mutant BRAF PTC revealed overrepresented stress response pathways and the absence of compensatory RTK activation - features that may underpin innate resistance. Importantly, resistant cell lines and patient samples had increased hallmarks of failed apoptosis; a cellular state defined by sublethal caspase activation and DNA damage. Further analysis suggests that the failed apoptotic phenotypes may have features of "minority mitochondrial outer membrane permeabilization (MOMP)" - a stress-related response characterized by fragmented and porous mitochondria known to contribute to cancer aggressiveness. We found that cells presenting with minority MOMP-like phenotypes are dependent on the apoptotic regulator, Mcl-1, as treatment with the Mcl-1 inhibitor, AZD5991, potently induced cell death in resistant cells. Furthermore, PI3K/AKT inhibitors sensitized resistant cells to BRAFi; an effect that was at least in part associated with reduced Mcl-1 levels. Together, these data implicate minority MOMP as a mechanism associated with intrinsic drug resistance and underscore the benefits of targeting Mcl-1 in mutant BRAF PTC.


Conflict of interest statement

The authors declare the following financial interests which may be considered as potential competing interests: AEA has an ownership interest in patent number 9880150 and a pending patent, PCT/US22/76492. The other authors declare no competing interests.

Figures

Fig. 1
Fig. 1. PTC cell lines have a differential response to BRAFi.
A Representative crystal violet staining of PTC cells after a 6-day incubation in DMSO or increasing concentrations of trametinib (5, 25 nM), PLX4720 (100, 1000 nM), or PLX8394 (100, 1000 nM). B Quantification of crystal violet staining represented by fold plate coverage compared to DMSO treatment. C S-phase entry analysis via EdU incorporation of PTC cell lines treated with DMSO, trametinib (25 nM), PLX4720 (1000 nM), or PLX8394 (1000 nM). D Western blot analysis of Rb phosphorylation in PTC cell lines treated for 24 h with trametinib (top), PLX4720 (middle), and PLX8394 (bottom). Data points are representative of composite fold changes of at least three independent experiments with error bars signifying ±SEM (B, C). The * is indicative of p < 0.05, ** of p < 0.01, *** of p < 0.001, and # p < 0.0001 as determined by one-way ANOVA analysis with multiple comparisons (B, C).
Fig. 2
Fig. 2. Resistant MDA-T32 PTC cell line has reduced adaptive response and higher inflammatory signaling.
A PTC cell lines treated overnight with PLX4720 (1000 nM) were lysed and analyzed for RTK phosphorylation using the RayBio® C-Series Human Receptor Tyrosine Kinase Phosphorylation Antibody Array. B Composite intensity of staining across all 71 antibody targets in RayBio phosphorylation array to assess RTK signaling in MDA-T32 and MDA-T41 cells after 24-h incubation with DMSO or PLX4720 (1000 nM) were normalized to the intrinsic positive controls and graphed as a fold signal intensity. Error bars are ±SEM, n = 2. (RTK array antibody legend available in supplemental Fig. 2A). C Hallmark pathways enriched in MDA-T32 (black) and MDA-T41 (gray) bars. Data was obtained from [32] for use with Gene Set Enrichment Analysis (GSEA) [41] application for comparative analysis. Pathways with NES > 1.5, FDR < 0.05 are shown. D, E Volcano plot of Cancer Inflammatory and Immunity Crosstalk RT2 qPCR array comparing gene expression in MDA-T32 cells to that of MDA-T41 after 24-h treatment with DMSO (D) or PLX4720 (1000 nM) (E). Orange dots denote select differentially expressed genes in inflammatory signaling and blue dots, mitogenic signaling.
Fig. 3
Fig. 3. MDA-T32 exhibits failed apoptosis hallmarks.
A Western blot analysis of apoptosis-associated proteins in PTC cell lines at basal conditions. B Quantified flow cytometry analysis of 7-aad staining in PTC cells. Data points are representative of the percentages of healthy cells (7-aad-) from three independent experiments with error bars signifying ±SEM, n = 3. C Representative confocal images of PTC cell lines stained with anti-COX-IV under 60× objective after overnight incubation in DMSO or PLX4720 (1000 nM) treatment. D Using Mitochondrial Network Analysis (MiNA) toolset to highlight differences in mitochondrial morphology between resistant and susceptible PTC cell lines. Data points are representative of MiNA analysis of at least 12 different cells from three different staining events. Error bars are ±SEM, the * is indicative of p < 0.05 as determined by one-way ANOVA analysis with multiple comparisons. E Western blot analysis of DRP-1 in PTC cell lines after an overnight incubation with DMSO or PLX4720 (1000 nM). F Bubble plot of KEGG transport and catabolism pathway comparing MDA-T32 to MDA-T41 displaying rich factor, p-value, and gene #.
Fig. 4
Fig. 4. MDA-T32 is reliant on Mcl-1.
A Western blot analysis of Mcl-1 in PTC cell lines after 24-h treatment with DMSO, PLX4720 (1000 nM), or PLX8394 (1000 nM). B, C Quantified Flow cytometry analysis of AnnexinV/7-aad (B) or MitoNIR (C) staining in PTC cells after an overnight incubation with DMSO or AZD5991 (1000 nM, 2000 nM, or 5000 nM). Data points are representative percentages of healthy cells (B) or unhealthy mitochondria (C) from three independent experiments with error bars signifying ±SEM, n = 3. The * is indicative of p < 0.05, ** of p < 0.01, *** of p < 0.001, and # p < 0.0001 as determined by one-way ANOVA analysis with multiple comparisons. D Western blot analysis of select failed apoptosis-associated proteins in PTC cell lines after a 4-h incubation with DMSO or AZD5991 (1 nM, 10 nM, 100 nM, 1000 nM, or 2000 nM). E Western blot analysis of Rb phosphorylation and Mcl-1 stabilization in PTC cell lines after a 24-h incubation with DMSO, PLX4720 (1000 nM), or AZD5991 (2000 nM or 5000 nM). F Western blot analysis of cell fractionation comparing cytosolic cytochrome c in MDA-T32 and MDA-T41.
Fig. 5
Fig. 5. OPN/IFNγ and Navitoclax elicit features of a minority MOMP-like phenotype in MDA-T41.
A Representative confocal images of parental MDA-T41 cells, MDA-T41 cells habitually treated with OPN (100 ng/mL) and IFNγ (20 ng/mL) for 7 days, or MDA-T41 cells habitually treated with Navitoclax (10 nM) for 7 days prior to being stained with anti-COX-IV, imaged under 60× objective. B Quantification of mitochondrial morphology using Mitochondrial Network Analysis (MiNA) toolset to highlight differences between habitually treated MDA-T41 cells. Data points are representative of MiNA analysis of at least 9 different cells from three different staining events. C Western blot analysis of failed apoptosis-associated proteins in MDA-T41 cells with or without habitual treatment with OPN (100 ng/mL) and IFNγ (20 ng/mL) or Navitoclax (10 nM). Cells were treated with DMSO or PLX4720 (1000 nM) for 24 h. D Quantification of crystal violet staining of parental MDA-T41 cells versus MDA-T41 cells chronically exposed to OPN and IFNγ after 6 days treated with increasing doses of PLX4720 (100 nM, 250 nM, 500 nM, and 1000 nM), represented by fold plate coverage compared to DMSO treatment. Error bars are ±SEM, the * is indicative of p < 0.05, ** of p < 0.01, *** of p < 0.001, and **** p < 0.0001 as determined by one-way ANOVA (B) and two-way ANOVA analysis (D) with multiple comparisons (B, D).
Fig. 6
Fig. 6. PI3K/AKT inhibition targets Mcl-1 dependency.
A Western blot analysis of PTC cell lines treated with monomer selective BRAFi and/or PI3K/AKT inhibitors. Cells were treated for 24 h with DMSO, AKT inhibitor MK2206, PI3K inhibitor BKM120, or either therapies in combination with PLX4720 or PLX8394. Lysates were probed with the indicated primary antibodies. B Fold plate coverage of crystal violet staining fixed proliferating PTC cells after a 6-day incubation in DMSO, MK2206, BKM120, or either therapy in combination with PLX4720 or PLX8394. The error bars are ±SEM (B). The * is indicative of p < 0.05, ** of p < 0.01, *** of p < 0.001, and # p < 0.0001 as determined by one-way ANOVA analysis with multiple comparisons (B). C Representative crystal violet staining of PTC cells after a 6-day incubation in DMSO MK2206, BMK120, or combination treatments with PLX4720 or PLX8394.
Fig. 7
Fig. 7. Ex vivo analysis of PTC patient samples reveals minority MOMP-like patterns.
A ~1–2 mm pieces of freshly resected PTC tissue samples were incubated with DMSO, trametinib (50 nM), or increasing concentrations (100 nM, 500 nM, 1000 nM, 5000 nM) of PLX4032 or PLX8394 for 48 h. Lysates were harvested, and samples were probed via western blot analysis. Quantification of phosphorylated ERK1/2 (pERK1/2) to ERK2 as determined by densitometry is graphed below. B RPPA protein targets represented in the mitochondrial permeabilization gene set [63] are shown. C Western blot analysis of Mcl-1 in PTC patient samples incubated with and without PLX4032 (1000 nm) for 24 h.
Fig. 8
Fig. 8. Inflammation-mediated minority MOMP-like drug resistance is dependent on Mcl-1.
Schematic overview of the proposed innate resistance mechanism of MDA-T32 mutant BRAFV600E PTC cell line. Mitogenic signaling stimulates the expression of inflammatory mediators and Mcl-1. Inflammatory signaling likely drives feed-forward activity and in parallel triggers minority MOMP-like mitochondrial stress. Elevated Mcl-1 levels are required to maintain sufficient mitochondrial viability in the inflamed, drug-resistant state.

References

    1. Davies H, Bignell GR, Cox C, Stephens P, Edkins S, Clegg S, et al. Mutations of the BRAF gene in human cancer. Nature. 2002;417:949–54. doi: 10.1038/nature00766. - DOI - PubMed
    1. Cancer Genome Atlas Research N Integrated genomic characterization of papillary thyroid carcinoma. Cell. 2014;159:676–90. doi: 10.1016/j.cell.2014.09.050. - DOI - PMC - PubMed
    1. Cabanillas ME, McFadden DG, Durante C. Thyroid cancer. Lancet. 2016;388:2783–95. doi: 10.1016/S0140-6736(16)30172-6. - DOI - PubMed
    1. Cho JS, Yoon JH, Park MH, Shin SH, Jegal YJ, Lee JS, et al. Age and prognosis of papillary thyroid carcinoma: retrospective stratification into three groups. J Korean Surg Soc. 2012;83:259–66. doi: 10.4174/jkss.2012.83.5.259. - DOI - PMC - PubMed
    1. Wu CC, Islam MM, Nguyen PA, Poly TN, Wang CH, Iqbal U, et al. Risk of cancer in long-term levothyroxine users: retrospective population-based study. Cancer Sci. 2021;112:2533–41. doi: 10.1111/cas.14908. - DOI - PMC - PubMed