. 2024 Apr 15;15(1):3219.
doi: 10.1038/s41467-024-47324-2.

Trace gas oxidation sustains energy needs of a thermophilic archaeon at suboptimal temperatures

Affiliations

Trace gas oxidation sustains energy needs of a thermophilic archaeon at suboptimal temperatures

Pok Man Leung et al. Nat Commun. .

Abstract

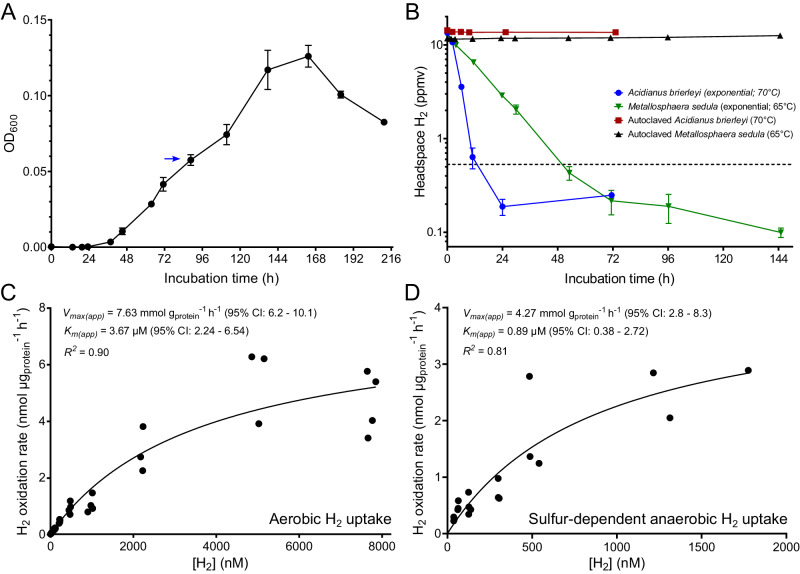
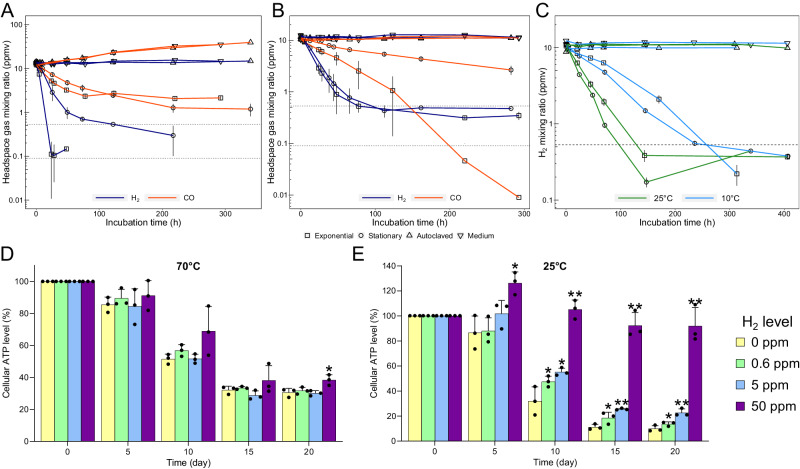
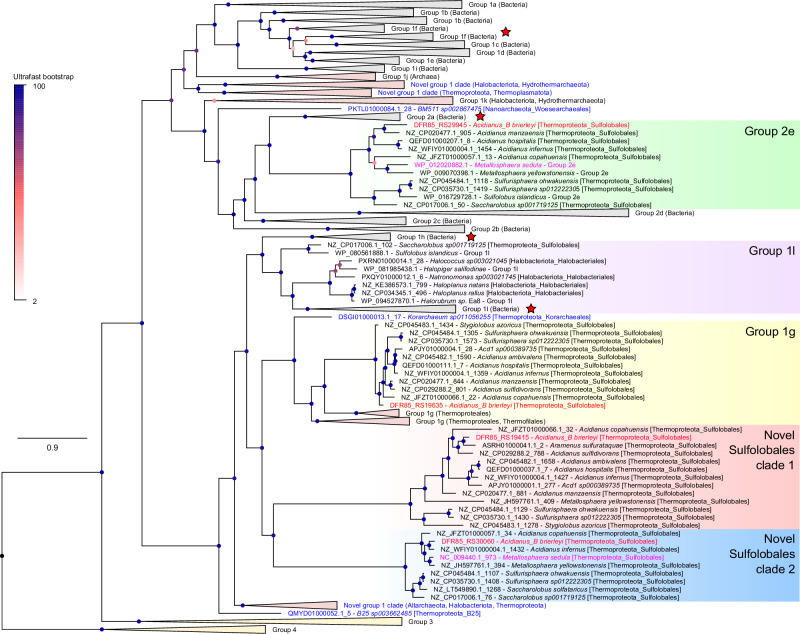
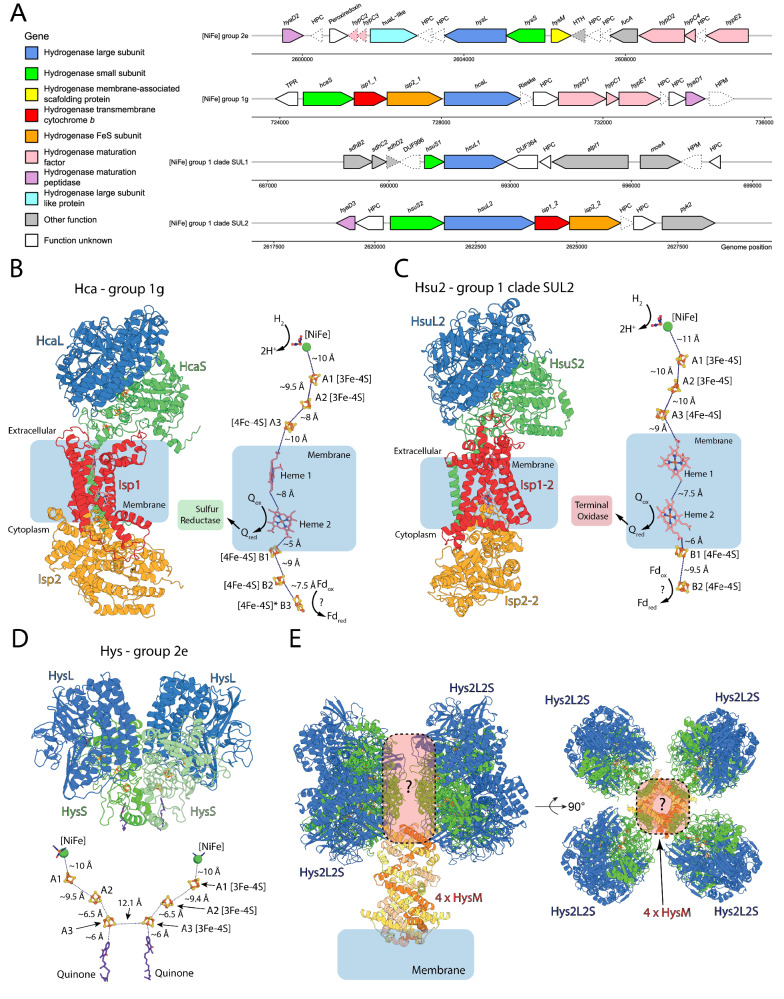
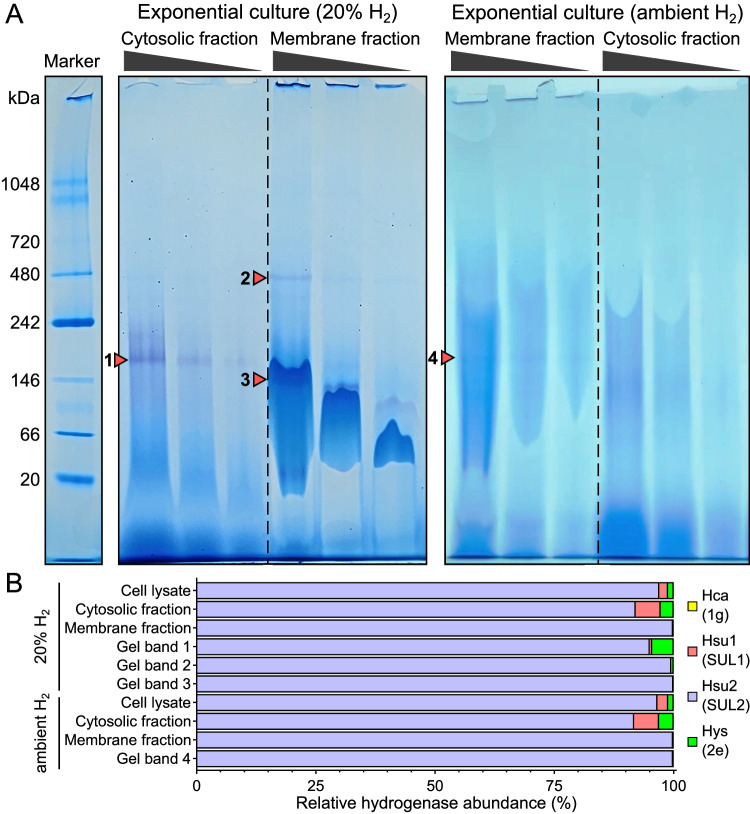
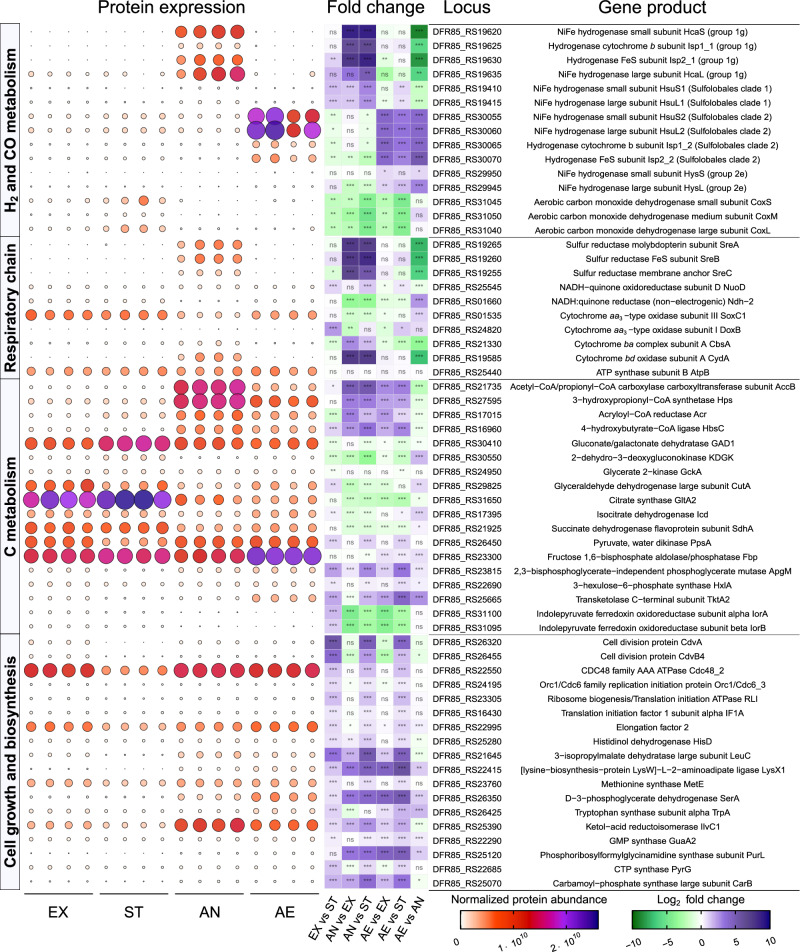
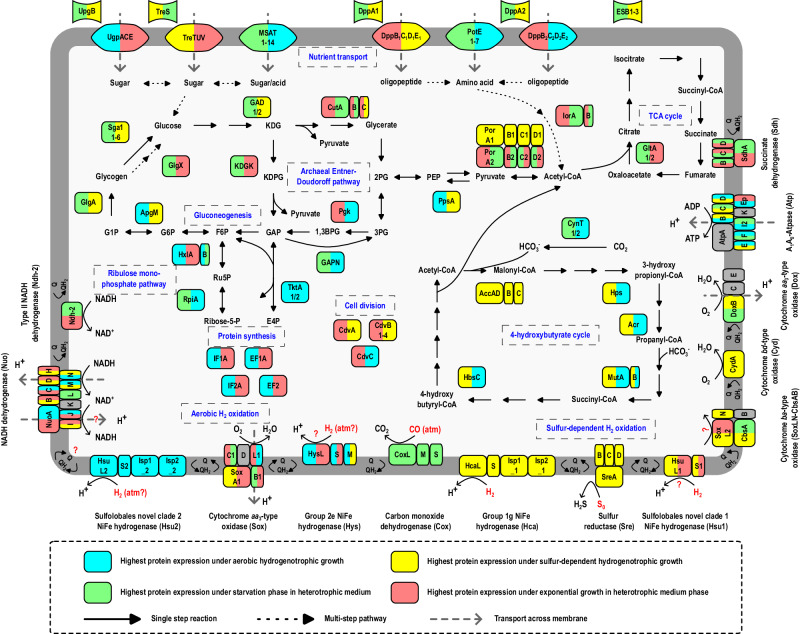
Diverse aerobic bacteria use atmospheric hydrogen (H2) and carbon monoxide (CO) as energy sources to support growth and survival. Such trace gas oxidation is recognised as a globally significant process that serves as the main sink in the biogeochemical H2 cycle and sustains microbial biodiversity in oligotrophic ecosystems. However, it is unclear whether archaea can also use atmospheric H2. Here we show that a thermoacidophilic archaeon, Acidianus brierleyi (Thermoproteota), constitutively consumes H2 and CO to sub-atmospheric levels. Oxidation occurs across a wide range of temperatures (10 to 70 °C) and enhances ATP production during starvation-induced persistence under temperate conditions. The genome of A. brierleyi encodes a canonical CO dehydrogenase and four distinct [NiFe]-hydrogenases, which are differentially produced in response to electron donor and acceptor availability. Another archaeon, Metallosphaera sedula, can also oxidize atmospheric H2. Our results suggest that trace gas oxidation is a common trait of Sulfolobales archaea and may play a role in their survival and niche expansion, including during dispersal through temperate environments.


Conflict of interest statement

The authors declare no competing interests.

Figures

Fig. 1
Fig. 1. Aerobic hydrogen (H2) oxidation during exponential growth of Acidianus brierleyi at 70 °C.
A Heterotrophic growth of A. brierleyi in DSMZ medium 150 base with 0.2 g l−1 yeast extract at 70 °C and pH 2. The blue arrow indicates the initial cell density where the H2 consumption experiment in (B) was performed on A. brierleyi. (B) Gas chromatography measurement of H2 oxidation to sub-atmospheric levels by A. brierleyi and Metallosphaera sedula at mid-exponential growth, with heat-killed cells as negative controls. Headspace H2 mixing ratio is presented on a logarithmic scale and the dotted line indicates the mean atmospheric H2 mixing ratio (0.53 ppmv). Data in both (A) and (B) are presented as mean ± S.D. values of three biological replicates (n = 3). Apparent kinetics of H2 oxidation by mid-exponential A. brierleyi cultures grown heterotrophically in (C) oxic and (D) anoxic conditions with elemental sulfur as the electron acceptor. A Michaelis–Menten non-linear regression model was used to calculate kinetic parameters and derive a best fit curve.
Fig. 2
Fig. 2. Acidianus brierleyi consumes atmospheric trace gases to enhance survival at various temperatures.
Gas chromatography measurement of simultaneous consumption of H2 and CO at (A) 70 °C and (B) 37 °C; and (C) continued H2 oxidation activity at 25 °C and 10 °C by mid-exponential and stationary phase cultures of A. brierleyi. Relative change in cellular ATP level (nmol/mgprotein) of stationary phase cultures of A. brierleyi supplemented daily with low levels of headspace H2 within twenty days at (D) 70 °C and (E) 25 °C. For all panels, data are presented as mean ± S.D. values of three biological replicates (n = 3); dotted lines in (AC) indicate the mean global atmospheric H2 (0.53 ppmv) and CO (0.09 ppmv) mixing ratios; and asterisks in (DE) indicate significantly higher cellular ATP level in H2-supplemented cultures than cultures with no extra H2 at the same timepoint based on one-sided Student’s t test (*p < 0.05; **p < 0.005). The exact p values are reported in the Source Data file.
Fig. 3
Fig. 3. Identification of four [NiFe]-hydrogenases in Acidianus brierleyi.
Maximum-likelihood phylogenetic reconstructions of amino acid sequences of the uptake group 1 and 2 [NiFe]-hydrogenase large (catalytic) subunits identified in A. brierleyi (4 sequences; red text), M. sedula (2 sequences; fuschia text), genomes of all archaeal representative species in Genome Taxonomy Database (GTDB) release 202 (202 sequences), and hydrogenase reference database HydDB (1003 sequences). Group 3 and 4 [NiFe]-hydrogenases were included as outgroups and the phylogeny was rooted between group 4 [NiFe]-hydrogenases and all other groups. Note that A. brierleyi is classified under a distinct genus from Acidianus (placeholder name Acidianus_B) in GTDB. Collapsed subgroups/clades that were exclusively bacterial or archaeal are shaded in gray or pink, respectively. Novel archaeal hydrogenase lineages are colored in blue or specified otherwise. Star symbols denote hydrogenase subgroups with members experimentally shown to mediate atmospheric H2 oxidation. Details on alignment and tree inference can be found in Methods and all sequences are provided in Supplementary Dataset 3. Each node was colored by ultrafast bootstrap support percentage (1000 replicates) and the scale bar indicates the average number of substitutions per site. The tree showing all taxa is provided in Supplementary Dataset 5.
Fig. 4
Fig. 4. Genetic organization and AlphaFold structural models of the four [NiFe]-hydrogenases in Acidianus brierleyi.
A Genetic organization of the four [NiFe]-hydrogenases encoded by A. brierleyi. Arrow outlines denote the presence (solid line) and absence (dotted line) of protein expression of the gene detected by shotgun proteomics under tested conditions. Gene length is shown to scale. HPC, hypothetical cytosolic protein; HPM, hypothetical membrane protein. Detailed information on loci, annotations and amino acid sequences of each gene are available in Supplementary Dataset 4. AlphaFold-derived models of the group 1g hydrogenase Hca (B), the novel group 1 clade SUL2 hydrogenase Hsu2 (C), and the group 2e hydrogenase Hys (D) are shown as a cartoon representation of the complex formed by the subunits identified in panel A (left/top panel) and the electron transport relay formed by modeled cofactors, with predicted electron donors and acceptors indicated (right/bottom panel). E A model of a higher order complex formed by Hys, incorporating the AlphaFold model of the HysM subunit, and based on the Cryo-EM structure of the group 2a hydrogenase Huc from Mycobacterium smegmatis.
Fig. 5
Fig. 5. Zymographic and mass spectrometric detection of hydrogenase activity in aerobic culture of Acidianus brierleyi.
A Hydrogenase activity staining of cytosolic and membrane fractions of A. brierleyi cells separated by blue native polyacrylamide gel electrophoresis and stained with artificial electron acceptor nitrotetrazolium blue chloride (NBT) under a 7%-H2 anaerobic atmosphere. Cells were harvested during aerobic organotrophic exponential growth in a headspace with either 20% H2 or ambient H2. 10, 5, and 2.5 µl of each fraction were loaded on the gel. The protein ladder in the left lane was stained with Coomassie blue. Purple bands indicated by arrows suggest reduction of NBT by hydrogenase activity. The shift in bands in membrane fraction is a known phenomenon due to the interaction between lipid, small membrane proteins, and Coomassie Blue G-250. The same experiment was repeated independently twice with same results (n = 2). (B) Mass spectrometric identification hydrogenases in A. brierleyi cell lysate, cytosolic fraction, membrane fraction, and positive bands indicated in (A). Relative abundance of the four hydrogenases based on iBAQ (Intensity-Based Absolute Quantification) is shown.
Fig. 6
Fig. 6. Quantitative comparison of selected Acidianus brierleyi proteins under heterotrophic growth, stationary phase, sulfur-dependent hydrogenotrophic growth, and aerobic hydrogenotrophic growth.
Culture condition (four biological replicates each): EX, mid-exponential growth phase on heterotrophic medium; ST, stationary phase on heterotrophic medium; AN, anaerobic sulfur-dependent hydrogenotrophic growth; AE, aerobic hydrogenotrophic growth (Methods). Normalized protein abundance value represents MaxLFQ total intensity for the protein. Bubble size and color indicate protein abundance of the corresponding gene product in each biological replicate. Significant difference in fold changes of protein abundance of each condition pair is denoted by asterisks (two-sided Student’s t-test with Benjamini-Hochberg correction; adjusted p value ≤ 0.001, ***≤0.01, **≤0.05, *>0.05, ns). The full set of quantitative proteomics results is provided in Supplementary Dataset 4.
Fig. 7
Fig. 7. Genome and proteome-based model of H2 metabolism in heterotrophic and hydrogenotrophic growth of Acidianus brierleyi.
The color scale indicates the conditions where proteins had the highest expression (left) and second highest expression if their log2 fold difference is less two (right). Metabolic marker genes for central carbon metabolism, trace gas oxidation, and respiratory chain are shown. AccADBC, acetyl-CoA/propionyl-CoA carboxylase; Acr, acryloyl-CoA reductase; ApgM, phosphoglycerate mutase; CdvABC, cell division proteins; CutABC, glyceraldehyde dehydrogenase; CynT, carbonic anhydrase; DppBCDE, ABC di/oligopeptide transporter; EF1A/EF2; elongation factors; GAD, gluconate/galactonate dehydratase; GAPN, glyceraldehyde-3-phosphate dehydrogenase; GlgA, glycogen synthase; GlgX, glycogen debranching protein; GltA, citrate synthase; HbsC, 4-hydroxybutyrate-CoA ligase; Hps, 3-hydroxypropionyl-CoA synthetase; HxlA, 3-hexulose-6-phosphate synthase; HxlB, 6-phospho-3-hexuloisomerase; IF1A/IF2A, translation initiation factors; IorAB, Indolepyruvate:ferredoxin oxidoreductase; KDGK, 2-dehydro-3-deoxygluconokinase; MSAT, major facilitator superfamily sugar/acid transporter; MutAB, methylmalonyl-CoA mutase; Pgk, phosphoglycerate kinase; PorABCD, pyruvate synthase; PotE, APC amino acid permease; PpsA, pyruvate, water dikinase; RpiA, ribose 5-phosphate isomerase; Sga1, glucoamylase; TktA, transketolase; UgpACE/TreTUV, ABC sugar transporter; UpgB/TreS/DppA/ESB, extracellular solute-binding proteins. Note that A. brierleyi is also known to grow chemolithoautotrophically on various reduced sulfur compounds and Fe2+ (Fig. S10), as extensively described in previous studies,,.

References

    1. Greening C, Grinter R. Microbial oxidation of atmospheric trace gases. Nat. Rev. Microbiol. 2022;20:513–528. doi: 10.1038/s41579-022-00724-x. - DOI - PubMed
    1. Novelli PCC, et al. Molecular hydrogen in the troposphere: global distribution and budget. J. Geophys. Res. Atmos. 1999;104:30427–30444. doi: 10.1029/1999JD900788. - DOI
    1. Constant P, Chowdhury SP, Pratscher J, Conrad R. Streptomycetes contributing to atmospheric molecular hydrogen soil uptake are widespread and encode a putative high-affinity [NiFe]-hydrogenase. Environ. Microbiol. 2010;12:821–829. doi: 10.1111/j.1462-2920.2009.02130.x. - DOI - PubMed
    1. Constant P, Chowdhury SP, Hesse L, Conrad R. Co-localization of atmospheric H2 oxidation activity and high affinity H2-oxidizing bacteria in non-axenic soil and sterile soil amended with Streptomyces sp. PCB7. Soil Biol. Biochem. 2011;43:1888–1893. doi: 10.1016/j.soilbio.2011.05.009. - DOI
    1. Greening C, Berney M, Hards K, Cook GM, Conrad R. A soil actinobacterium scavenges atmospheric H using two membrane-associated, oxygen-dependent [NiFe] hydrogenases. Proc. Natl Acad. Sci. USA. 2014;111:4257–4261. doi: 10.1073/pnas.1320586111. - DOI - PMC - PubMed