. 2024 Apr;56(4):1001-1012.
doi: 10.1038/s12276-024-01213-2. Epub 2024 Apr 16.

Loss of SREBP-1c ameliorates iron-induced liver fibrosis by decreasing lipocalin-2

Affiliations

Loss of SREBP-1c ameliorates iron-induced liver fibrosis by decreasing lipocalin-2

Eun-Ho Lee et al. Exp Mol Med. 2024 Apr.

Abstract

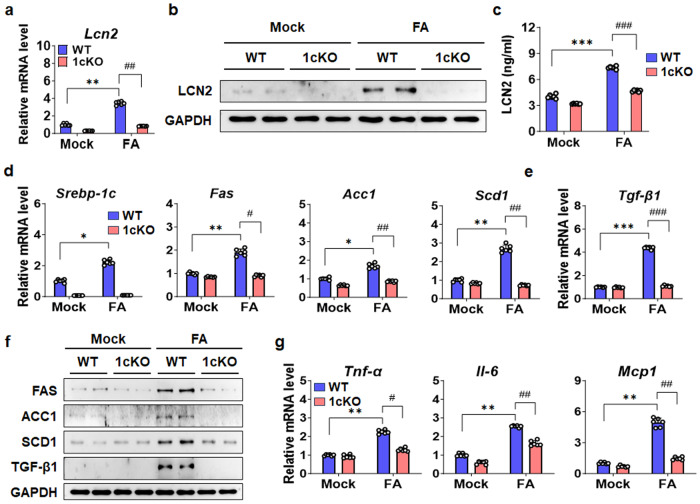
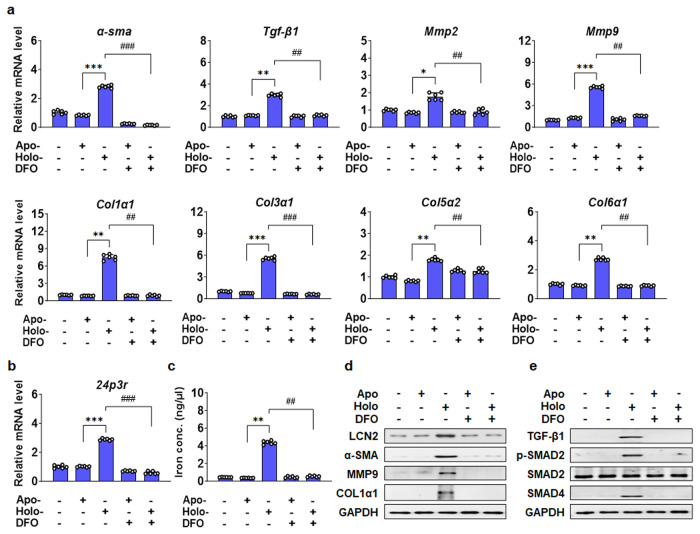
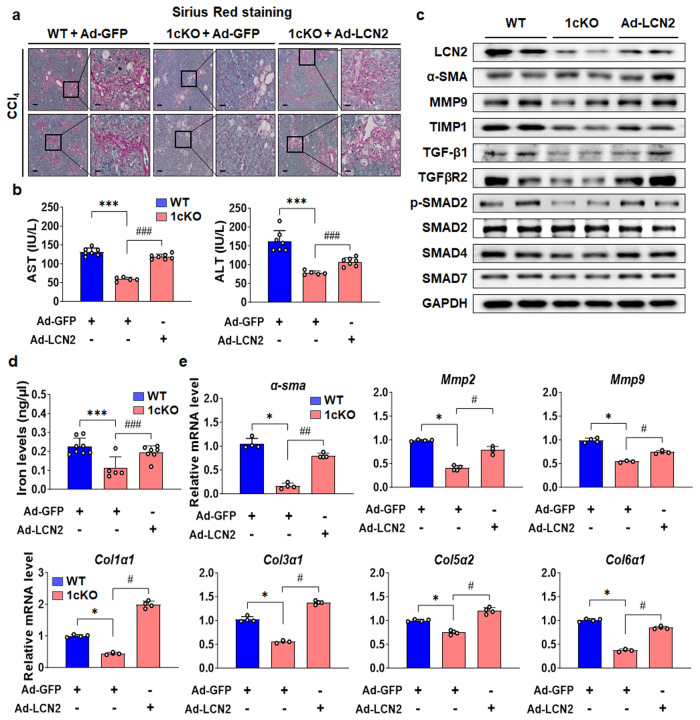
Sterol regulatory element-binding protein (SREBP)-1c is involved in cellular lipid homeostasis and cholesterol biosynthesis and is highly increased in nonalcoholic steatohepatitis (NASH). However, the molecular mechanism by which SREBP-1c regulates hepatic stellate cells (HSCs) activation in NASH animal models and patients have not been fully elucidated. In this study, we examined the role of SREBP-1c in NASH and the regulation of LCN2 gene expression. Wild-type and SREBP-1c knockout (1cKO) mice were fed a high-fat/high-sucrose diet, treated with carbon tetrachloride (CCl4), and subjected to lipocalin-2 (LCN2) overexpression. The role of LCN2 in NASH progression was assessed using mouse primary hepatocytes, Kupffer cells, and HSCs. LCN2 expression was examined in samples from normal patients and those with NASH. LCN2 gene expression and secretion increased in CCl4-induced liver fibrosis mice model, and SREBP-1c regulated LCN2 gene transcription. Moreover, treatment with holo-LCN2 stimulated intracellular iron accumulation and fibrosis-related gene expression in mouse primary HSCs, but these effects were not observed in 1cKO HSCs, indicating that SREBP-1c-induced LCN2 expression and secretion could stimulate HSCs activation through iron accumulation. Furthermore, LCN2 expression was strongly correlated with inflammation and fibrosis in patients with NASH. Our findings indicate that SREBP-1c regulates Lcn2 gene expression, contributing to diet-induced NASH. Reduced Lcn2 expression in 1cKO mice protects against NASH development. Therefore, the activation of Lcn2 by SREBP-1c establishes a new connection between iron and lipid metabolism, affecting inflammation and HSCs activation. These findings may lead to new therapeutic strategies for NASH.


Conflict of interest statement

The authors declare no competing interests.

Figures

Fig. 1
Fig. 1. Increased hepatic fibrosis is reduced in 1cKO mice.
a WT and 1cKO mice were fed a HFHS diet for 20 weeks, to increase body weight (n = 5–10 per group). b Images of the livers of HFHS-fed mice. c Hepatic TG levels in HFHS-fed WT and 1cKO mice. Images of liver sections stained with H&E (d) and Masson’s trichrome (e) (scale bars: 30 μm). f qPCR analysis of α-sma, Col1α1, and Tnf-α mRNA expression in the liver. g Immunoblot analysis of α-SMA, COL1α1, and TGF-β1. h Scheme for mouse experimental design and CCl4 injection. The mice were intramuscularly injected with olive oil or CCl4 twice per week for 5 weeks. i Body weights of CCl4-treated WT and 1cKO mice. Images of Masson’s trichrome (j) and Sirius red (k) stained liver sections (n = 3–5 per group) from CCl4-treated WT and 1cKO mice (scale bars: 100 and 30 μm). l mRNA levels of α-sma, Col1α1, Col3α1, Col5α2, and Tgf-β1 were measured by qPCR. Values are expressed as the mean ± SEM. *p < 0.05, **p < 0.01, and ***p < 0.001 compared to Con WT mice. #p < 0.05 and ##p < 0.01 compared to HFHS-fed and CCl4-treated WT mice.
Fig. 2
Fig. 2. LCN2 expression is regulated by SREBP-1c.
a Lcn2 mRNA expression levels in the livers of WT and 1cKO mice were measured after 24 h of fasting followed by 12 h of refeeding. b Consensus SREBP-1c binding sequences for LCN2 were identified by ChIP-sequencing and MEME analysis. c mRNA levels of SR-1c, FAS, and LCN2 in Huh7 cells infected with Ad-SR1c. d SR-1c and LCN2 mRNA levels in Huh7 cells transfected with siRNA targeting SREBP-1i. e The effect of SREBP-1c on mouse Lcn2 promoter activity was determined by cotransfecting HEK293T cells with an LCN2 reporter construct and SREBP-1c expression vector. f Mutations in the SRE motif of the -829 Lcn2 reporter were evaluated to determine their impact on reporter activity. g ChIP assay was performed to assess SREBP-1 binding in hepatic chromatin from WT or 1cKO mice, and the results were analyzed by qPCR. h Immunohistochemical staining of liver sections for LCN2 and quantification of LCN2-positive areas (n = 10 per group; scale bars: 30 μm). i mRNA expression levels of Lcn2 in WT and 1cKO mice fed a HFHS diet for 20 weeks. j Analysis of serum LCN2 concentrations. k qPCR analysis of Lcn2 gene expression in the livers of WT and 1cKO mice treated with CCl4 for 5 weeks. l Immunoblot analysis of LCN2 protein levels in the livers of WT and 1cKO mice. m Measurement of serum LCN2 concentrations. Values represent mean ± SEM. *p < 0.05, **p < 0.01, and ***p < 0.001 compared to respective control groups. ##p < 0.01 and ###p < 0.001 compared to corresponding WT mice.
Fig. 3
Fig. 3. Effect of FA on LCN2 gene expression in primary hepatocytes.
a Lcn2 mRNA expression levels in mouse primary hepatocytes after FA treatment for 24 h. b LCN2 protein levels in FA-treated mouse primary hepatocytes. c LCN2 concentration in the FA treated supernatant medium. d Expression levels of the lipogenic genes Srebp-1c, Fas, Acc1, and Scd1 in FA-treated mouse primary hepatocytes. e mRNA expression of Tgf-β1. f FAS, ACC1, SCD1, and TGF-β1 protein levels in mouse primary hepatocytes. g qPCR analysis of Tnf-α, Il-6, and Mcp1 mRNA expression in mouse primary hepatocytes after FA treatment. Values are expressed as mean ± SEM. *p < 0.05, **p < 0.01, and ***p < 0.001 compared to Mock WT mice. #p < 0.05, ##p < 0.01, and ###p < 0.001 compared to FA-treated WT mice.
Fig. 4
Fig. 4. Effect of FA on LCN2 gene expression in KCs.
a Lcn2 mRNA expression levels in WT and 1cKO KCs after FA treatment for 24 h. b Immunoblot analysis of LCN2 protein levels in KCs. c Measurement of LCN2 concentrations in the medium of KCs treated with FA. d qPCR analysis of Srebp-1c, Fas, Acc1, and Scd1 mRNA expression. e mRNA expression of Tgf-β1. f TGF-β1 protein levels in WT and 1cKO KCs treated with FA. g F4/80, Tnf-α, Il-1β, Il-6, and Mcp1 mRNA levels in KCs. Values are expressed as mean ± SEM. *p < 0.05, **p < 0.01, and ***p < 0.001 compared to Mock WT mice. #p < 0.05, ##p < 0.01, and ###p < 0.001 compared to FA-treated WT mice.
Fig. 5
Fig. 5. DFO effect on LCN2-induced primary HSCs activation.
a mRNA expression levels of α-sma, Tgf-β1, Mmp2, Mmp9, Clo1α1, Col3α1, Col5α2, and Col6α1 in primary HSCs treated with apo-LCN2, holo-LCN2, and DFO for 24 h were measured by qPCR. b 24p3r gene expression. c Iron concentration in the lysates of primary HSCs. d Immunoblot analysis of LCN2, α-SMA, MMP9, and COL1α1 protein expression. e Protein levels of TGF-β1, p-SMAD2, SMAD2, and SMAD4 in primary HSCs treated with apo-LCN2, holo-LCN2, and DFO. Values are expressed as mean ± SEM. *p < 0.05 and **p < 0.01 compared to mock apo-LCN2-treated primary HSCs. #p < 0.05 and ##p < 0.01 compared to DFO-treated primary HSCs.
Fig. 6
Fig. 6. Overexpression of LCN2 in CCl4-induced 1cKO mice.
a Sirius red staining of the livers of CCl4- and ad-LCN2-treated WT and 1cKO mice (n = 5–7 per group; scale bars: 100 and 30 μm). b Serum AST and ALT levels. c LCN2, α-SMA, MMP9, TIMP1, TGF-β1, TGFβR2, p-SMAD2, SMAD2, SMAD4, and SMAD7 protein levels in the liver. d Intracellular iron concentration in the liver. e ECM and fibrosis marker genes α-sma, Mmp2, Mmp9, Col1α1, Col3α1, Col5α2, and Col6α1 in the liver. Values are expressed as mean ± SEM. *p < 0.05 and ***p < 0.001 compared to CCl4-treated WT mice. #p < 0.05, ##p < 0.01, and ###p < 0.001 compared to CCl4-treated 1cKO mice.
Fig. 7
Fig. 7. LCN2 expression is associated with lipid metabolism, fibrosis, and inflammation-related genes in the human liver transcriptome.
a Scatter plot showing hepatic LCN2 expression in 226 human donors. Bubble plot (b), GSEA enrichment plot (c), and heatmaps (d) showing the GSEA results and the expression profiles of 30 representative genes in 12 gene sets enriched in the LCN2-high subgroup. GSEA was performed on the transcriptomes of the LCN2-high and LCN2-low groups (n = 20 per group). e H&E-stained liver histologic images from the LCN2-high and LCN2-low groups. The white bars indicate the scales of images. f Boxplot showing the expression of each indicated gene involved in NASH. The data are presented as the 25th quartile, the median, and the 75th quartile. Scatter plots illustrating positive correlations between hepatic LCN2 expression and fibrosis stage (g) or NASH score (h) in human livers. Values are expressed as mean ± SEM. **p < 0.01, ***p < 0.001, and ****p < 0.0001 compared to control.
Fig. 8
Fig. 8. In human patients with NASH livers, LCN2 expression is elevated and positively correlated with NASH phenotypes.
a AST, ALT, TG, and TC levels in normal and NASH patient serum (normal, n = 36; and NASH, n = 35). Images of Masson’s trichrome (b) and H&E (c) stained normal and NASH patient liver sections (scale bars: 100 and 30 μm) (normal, n = 6; and NASH, n = 35). d SREBP-1c and LCN2 mRNA levels (normal, n = 26; and NASH, n = 35). e LCN2 in normal and NASH patient serum (normal, n = 26; and NASH, n = 35). f pSREBP-1, nSREBP-1, and LCN2 protein levels. Values are expressed as mean ± SEM. *p < 0.05 and ***p < 0.001 compared to normal group.

References

    1. Wobser H, et al. Lipid accumulation in hepatocytes induces fibrogenic activation of hepatic stellate cells. Cell Res. 2009;19:996–1005. doi: 10.1038/cr.2009.73. - DOI - PubMed
    1. Tomita K, et al. Free cholesterol accumulation in hepatic stellate cells: mechanism of liver fibrosis aggravation in nonalcoholic steatohepatitis in mice. Hepatology. 2014;59:154–169. doi: 10.1002/hep.26604. - DOI - PubMed
    1. Zhang CY, Yuan WG, He P, Lei JH, Wang CX. Liver fibrosis and hepatic stellate cells: etiology, pathological hallmarks and therapeutic targets. World J. Gastroenterol. 2016;22:10512–10522. doi: 10.3748/wjg.v22.i48.10512. - DOI - PMC - PubMed
    1. Pei K, et al. An overview of lipid metabolism and nonalcoholic fatty liver disease. Biomed. Res. Int. 2020;2020:4020249. doi: 10.1155/2020/4020249. - DOI - PMC - PubMed
    1. Brankovic M, et al. Lipotoxicity as the leading cause of non-alcoholic steatohepatitis. Int. J. Mol. Sci. 2022;23:5146. doi: 10.3390/ijms23095146. - DOI - PMC - PubMed

Publication types

MeSH terms