. 2024 Apr 16;14(1):8725.
doi: 10.1038/s41598-024-59293-z.

Exclusive expression of KANK4 promotes myofibroblast mobility in keloid tissues

Affiliations

Exclusive expression of KANK4 promotes myofibroblast mobility in keloid tissues

Mayumi Oishi et al. Sci Rep. .

Abstract

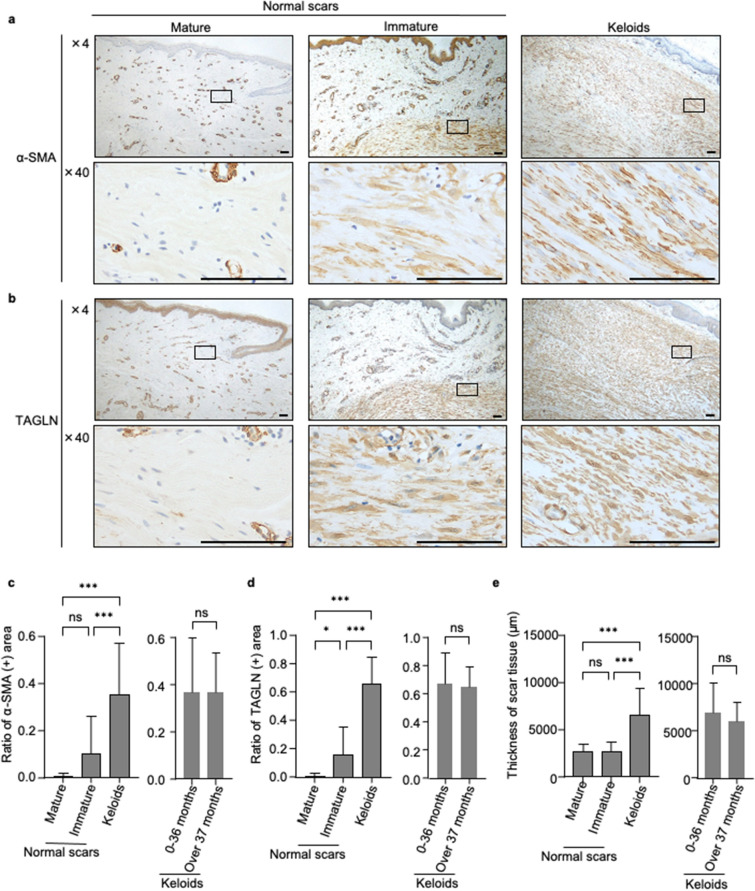
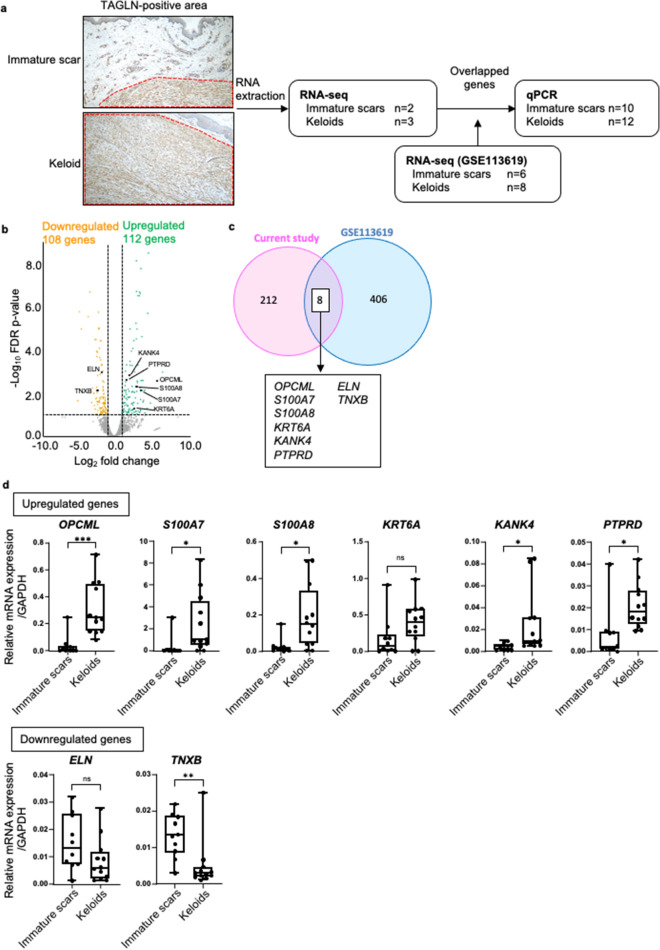
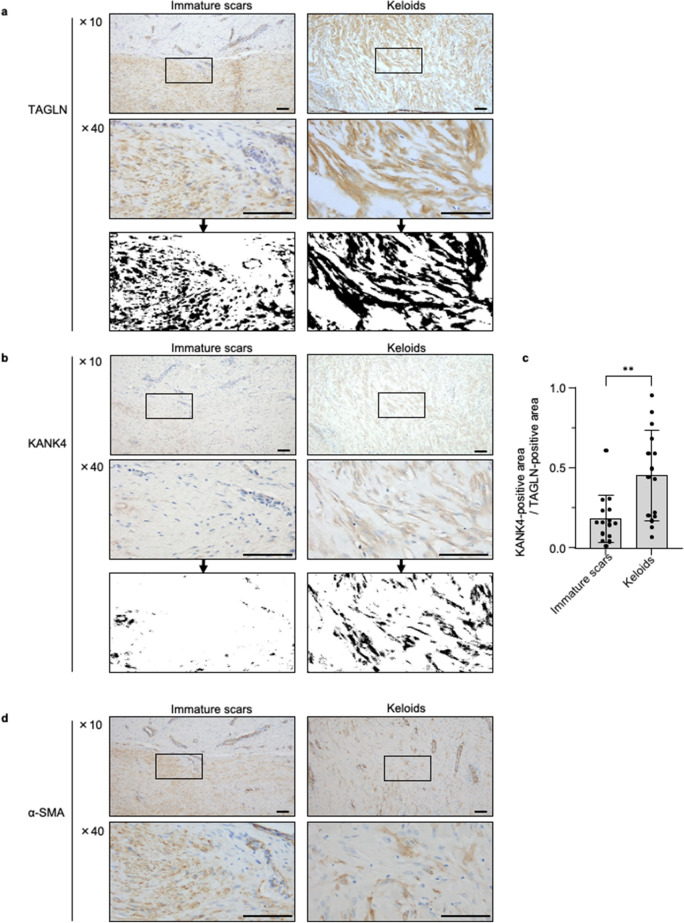
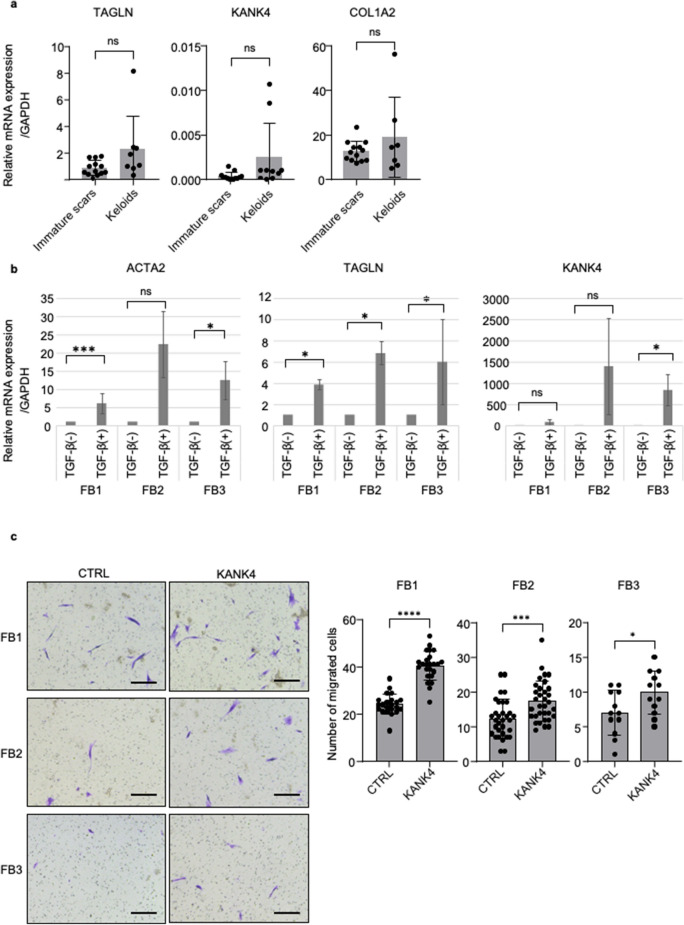
Keloids are characterized by abnormal wound healing with excessive accumulation of extracellular matrix. Myofibroblasts are the primary contributor to extracellular matrix secretion, playing an essential role in the wound healing process. However, the differences between myofibroblasts involved in keloid formation and normal wound healing remain unclear. To identify the specific characteristics of keloid myofibroblasts, we initially assessed the expression levels of well-established myofibroblast markers, α-smooth muscle actin (α-SMA) and transgelin (TAGLN), in scar and keloid tissues (n = 63 and 51, respectively). Although myofibroblasts were present in significant quantities in keloids and immature scars, they were absent in mature scars. Next, we conducted RNA sequencing using myofibroblast-rich areas from keloids and immature scars to investigate the difference in RNA expression profiles among myofibroblasts. Among significantly upregulated 112 genes, KN motif and ankyrin repeat domains 4 (KANK4) was identified as a specifically upregulated gene in keloids. Immunohistochemical analysis showed that KANK4 protein was expressed in myofibroblasts in keloid tissues; however, it was not expressed in any myofibroblasts in immature scar tissues. Overexpression of KANK4 enhanced cell mobility in keloid myofibroblasts. Our results suggest that the KANK4-mediated increase in myofibroblast mobility contributes to keloid pathogenesis.


Conflict of interest statement

The authors declare no competing interests.

Figures

Figure 1
Figure 1
Distribution of myofibroblasts of normal scars and keloids. (a,b) Representative image of immunohistochemical analyses for α-SMA (a) and TAGLN (b) in mature scars, immature scars and keloids. Rectangle areas are magnified in the second row (magnification 40×). Scale bar: 100 μm. (c) Left panel: Percentage of areas with α-SMA-positive myofibroblasts in the whole scars. Scars were grouped as mature scars (n = 10), immature scars (n = 51), and keloids (n = 44). Right panel: Keloid samples were further divided into two subgroups, namely those formed within 36 months after injury (n = 24) and those formed after 37 months (n = 16). Error bars show the mean ± SD. P-value was determined suing the two-tailed t-test. ***P < 0.001. (d) Left panel: Percentage of areas with TAGLN-positive myofibroblasts in the whole scars. Scars were grouped as mature scars (n = 10), immature scars (n = 53), and keloids (n = 51). Right panel: Keloid samples were further divided in to two subgroups, namely those formed within 36 months after injury (n = 27) and those formed after 37 months (n = 19). Error bars show the mean ± SD. P-value was determined using the two-tailed t-test. *P < 0.05, ***P < 0.001. (e) Left panel: Thickness of scar tissue. Distances was determined by measuring the perpendicular distance from the bottom of the epidermal basal layer to the adipose layer. Five different fields were used for measurement in each sample, and average distance was used for calculation. Scars were grouped as mature scars (n = 10), immature scars (n = 53) and keloids (n = 51; left). Right panel: Keloid samples were further divided into two subgroups, namely those formed within 36 months after injury (n = 27) and those formed after 37 months (n = 19). Error bars show the mean ± SD. P-value was determined using the two-tailed t-test. ***P < 0.001. α-SMA α-smooth muscle actin, ns not significant, SD standard deviation, TAGLN transgelin.
Figure 2
Figure 2
3′ RNA-seq analysis identified keloid specific differentially expressed genes. (a) Scheme of dissections of the TAGLN-positive area, and workflow of the analysis performed in this study. (b) 3′ RNA-seq analysis for immature scars (n = 2) and keloids (n = 3). Volcano plots showing the differentially 112 upregulated genes and 108 downregulated genes in keloids (fold change > 2, FDR P-value ≤ 0.1). (c) Venn diagram showing the eight shared differentially expressed genes among the aforementioned 220 genes identified though the current 3′ RNA-seq analysis and 414 genes detected in the GSE113619 dataset (fold change > 2, FDR P-value ≤ 0.1). (d) Relative mRNA expressions of the eight differentially expressed genes in immature scars (n = 10) and keloids (n = 12) compared with GAPDH. Error bars show the mean ± SD. P-value was determined using the two-tailed t-test. *P < 0.05, **P < 0.01, ***P < 0.001. ELN elastin, FDR false discovery rate, GAPDH glyceraldehyde-3-phosphate dehydrogenase, KANK4 KN motif and ankyrin repeat domains 4, KRT6A keratin 6A, OPCML opioid binding protein/cell adhesion molecule like, PTPRD protein tyrosine phosphatase receptor type D, qPCR quantitative polymerase chain reaction, RNA-seq RNA sequencing, S100A7 S100 calcium binding protein A7, TNXB tenascin XB, S100A8 S100 calcium binding protein A8, SD standard deviation, TAGLN transgelin.
Figure 3
Figure 3
KANK4 protein was specifically expressed in keloid myofibroblasts. (a,b) Representative image immunohistochemical analyses for TAGLN (a) and KANK4 (b) using serial sections of the TAGLN-positive areas of normal scars and keloids. Magnification: × 10 and × 40. Scale bar: 100 μm. The bottom images show the binarized images from × 40 magnified images. (c) Ratio of the KANK4-positive area to the TAGLN-positive area, calculated using binarized imaged in immature scars (n = 15) and keloids (n = 15). Error bars show the mean ± SD. P-value was determined using the two-tailed t-test. **P < 0.01. (d) Representative image immunohistochemical analyses for α-SMA. Magnification: × 10 and × 40. Scale bar: 100 μm. KANK4 KN motif and ankyrin repeat domains 4, TAGLN transgelin, SD standard deviation.
Figure 4
Figure 4
KANK4 promoted cell mobility of fibroblasts. (a) mRNA expression levels of established primary fibroblasts from immature scar (n = 13) and keloid (n = 10) tissues. Error bars show the mean ± SD. P-value was determined using the two-tailed t-test. (b) mRNA expression levels of ACTA2, TAGLN, and KANK4 after treatment with TGF-β (10 ng/μl) for 24 h. Error bars show the mean ± SD. P-value was determined using the two-tailed t-test. *P < 0.05. (c) Representative image of migrated cells in Transwell assay after transfection of cells with pcDNA3-EGFP (CTRL) or pcDNA3-EGFP-KANK4 (KANK4) for 48 h. Scale bar: 250 μm (left). The bar graphs show the number of migrated cells, counted in each field under a microscope (right). Error bars show the mean ± SD. P-value was determined using the two-tailed t-test. ***P < 0.001, ****P < 0.0001. ACTA2 actin alpha 2, COL1A2 collagen type I alpha 2 chain, CTRL control, EGFP enhanced green fluorescent protein, KANK4 KN motif and ankyrin repeat domains 4, ns not significant, TAGLN transgelin, TGF-β transforming growth factor-β, SD standard deviation.

References

    1. Abergel RP, et al. Biochemical composition of the connective tissue in keloids and analysis of collagen metabolism in keloid fibroblast cultures. J. Investig. Dermatol. 1985;84:384–390. doi: 10.1111/1523-1747.ep12265471. - DOI - PubMed
    1. Alibert, J.-L.-M. Descriptions des maladies de la peau observées a l'Hôpital Saint-Louis, et exposition des meilleures méthodes suivies pour leur traitement. Paris: Barrois l’ainé. vol. 2 (1806).
    1. Karppinen SM, Heljasvaara R, Gullberg D, Tasanen K, Pihlajaniemi T. Toward understanding scarless skin wound healing and pathological scarring. F1000Res. 2019;8:787. doi: 10.12688/f1000research.18293.1. - DOI - PMC - PubMed
    1. Macarak EJ, Wermuth PJ, Rosenbloom J, Uitto J. Keloid disorder: Fibroblast differentiation and gene expression profile in fibrotic skin diseases. Exp. Dermatol. 2021;30:132–145. doi: 10.1111/exd.14243. - DOI - PubMed
    1. Walsh LA, et al. Keloid treatments: An evidence-based systematic review of recent advances. Syst. Rev. 2023;12:42. doi: 10.1186/s13643-023-02192-7. - DOI - PMC - PubMed