Randomized Controlled Trial
. 2024 Jun;38(9):1755-1761.
doi: 10.1038/s41433-024-03015-2. Epub 2024 Apr 15.

Aqueous humour interleukin-6 and vision outcomes with anti-vascular endothelial growth factor therapy

Collaborators, Affiliations
Randomized Controlled Trial

Aqueous humour interleukin-6 and vision outcomes with anti-vascular endothelial growth factor therapy

Yasir Jamal Sepah et al. Eye (Lond). 2024 Jun.

Abstract

Background: This analysis evaluated aqueous humour (AH) interleukin (IL)-6 concentrations and the association between AH IL-6 and visual outcomes in patients with neovascular age-related macular degeneration (nAMD) or diabetic macular oedema (DMO) receiving anti-vascular endothelial growth factor (VEGF) monotherapy.

Methods: Post hoc analysis of the multicentre, double-masked, randomised HARBOR (NCT00891735) and READ-3 (NCT01077401) trials. HARBOR enrolled treatment-naïve nAMD patients. READ-3 enrolled treatment-naïve/previously treated DMO patients. HARBOR patients received ranibizumab 0.5 or 2.0 mg monthly or as needed; AH samples were collected at month 2, after two previous intravitreal injections. READ-3 patients received ranibizumab 0.5 or 2.0 mg as needed; AH samples were collected at baseline and months 3, 6, 9, and 12.

Main outcome measure: association between AH IL-6 concentrations and month 24 best-corrected visual acuity (BCVA).

Results: In both trials (HARBOR, N = 36; READ-3, N = 137), patients with higher AH IL-6 concentrations had worse visual outcomes. HARBOR patients with low AH IL-6 concentrations at month 2 had a mean (95% CI) BCVA change at month 24 of +2.9 (-2.6, 8.3) letters, whereas patients with high AH concentrations had a mean (95% CI) BCVA change of -9.0 (-22.7, 4.7) letters. READ-3 patients with low AH concentrations at baseline had a mean (95% CI) BCVA change at month 12 of +9.3 (7.4, 11.3) letters, whereas patients with high AH concentrations had a mean (95% CI) BCVA change of +5.6 (2.2, 9.1) letters.

Conclusions: Higher IL-6 AH concentrations may predict suboptimal visual responses to anti-VEGF monotherapy in patients with nAMD/DMO.


Conflict of interest statement

YJS reports being a consultant for Belite Bio, Boehringer Ingelheim, Kriya Therapeutics, and Regenxbio. DVD reports being a consultant for EyePoint, Genentech, Inc., Kodiak Sciences, Novartis, Regeneron, and Santen. MM and SF are employees of F. Hoffmann-La Roche Ltd. BD, SB, and IS are employees of Genentech, Inc. RA and MSH are employees of Ocular Imaging Research & Reading Center. KH was an employee of Genentech, Inc., during the course of this study (current employee of Immune-Onc Therapeutics, Inc.). EW was an employee of Genentech, Inc., during the course of this study (current employee of E.W. Consulting). QDN reports being a consultant for Genentech, Inc., Kriya, Regeneron, Rezolute, and Santen.

Figures
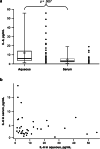
Fig. 1
Fig. 1. Interleukin (IL)-6 concentrations measured in aqueous humour and serum samples collected at month 2 of HARBOR.
Box and whisker and scatter plots (a) and individual patient-level (b) interleukin (IL)-6 concentrations. In the box and whisker plot, the top and bottom lines of the box indicate the first and third quartiles, the centre line in the box indicates the median, the ends of the lines indicate the maxima and minima and the diamond indicates the mean. Pearson correlation coefficient: −0.1696. *Derived from Wilcoxon rank sum test comparing median aqueous humour and serum IL 6 concentrations.
Fig. 2
Fig. 2. Change in best-corrected visual acuity (BCVA) over time in patients with high (≥15 pg/mL) and low (<15 pg/mL) aqueous humour interleukin (IL)-6 concentrations at month 2 of HARBOR.
Data are mean (95% confidence interval). ETDRS Early Treatment Diabetic Retinopathy Study.
Fig. 3
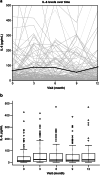
Fig. 3. Aqueous humour interleukin (IL)-6 concentrations measured from baseline through month 12 of READ-3.
Individual (grey lines in (a)), mean (black line in (a)), and box and whisker and scatter plots (b). In the box and whisker plot, the top and bottom lines of the box indicate the first and third quartiles, the centre line in the box indicates the median and the ends of the lines indicate the maxima and minima. The 0.5- and 2.0-mg ranibizumab doses were combined for analysis. A fixed range of 0–500 pg/mL for IL-6 concentration was used for improved visualisation in these figures.
Fig. 4
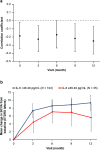
Fig. 4. Correlation between interleukin (IL)-6 concentration at baseline and best-corrected visual acuity (BCVA) and change in BCVA over time stratified by baseline IL-6 concentration in READ-3.
Correlation between aqueous humour IL-6 concentration at baseline (visit 0) and BCVA measured at each time point (a). Change in BCVA over time in patients with high (≥46.49 pg/mL) and low (<46.49 pg/mL) aqueous humour IL-6 concentrations at baseline (b). Data are a Spearman correlation coefficient (95% confidence interval [CI]) and b mean (95% confidence interval). ETDRS Early Treatment Diabetic Retinopathy Study.

References

    1. Tanaka T, Narazaki M, Kishimoto T. IL-6 in inflammation, immunity, and disease. Cold Spring Harb Perspect Biol. 2014;6:a016295. doi: 10.1101/cshperspect.a016295. - DOI - PMC - PubMed
    1. Mesquida M, Leszczynska A, Llorenç V, Adán A. Interleukin-6 blockade in ocular inflammatory diseases. Clin Exp Immunol. 2014;176:301–9. doi: 10.1111/cei.12295. - DOI - PMC - PubMed
    1. Rezar-Dreindl S, Sacu S, Eibenberger K, Pollreisz A, Bühl W, Georgopoulos M, et al. The intraocular cytokine profile and therapeutic response in persistent neovascular age-related macular degeneration. Investig Ophthalmol Vis Sci. 2016;57:4144–50. doi: 10.1167/iovs.16-19772. - DOI - PubMed
    1. Feng J, Zhao T, Zhang Y, Ma Y, Jiang Y. Differences in aqueous concentrations of cytokines in macular edema secondary to branch and central retinal vein occlusion. PLoS ONE. 2013;8:e68149. doi: 10.1371/journal.pone.0068149. - DOI - PMC - PubMed
    1. Minaker SA, Mason RH, Bamakrid M, Lee Y, Muni RH. Changes in aqueous and vitreous inflammatory cytokine levels in retinal vein occlusion: a systematic review and meta-analysis. J VitreoRetin Dis. 2020;4:36–64. doi: 10.1177/2474126419880391. - DOI - PMC - PubMed

Publication types

MeSH terms