. 2024 May;9(5):1293-1311.
doi: 10.1038/s41564-024-01658-1. Epub 2024 Apr 15.

Age-specific nasal epithelial responses to SARS-CoV-2 infection

Affiliations

Age-specific nasal epithelial responses to SARS-CoV-2 infection

Maximillian N J Woodall et al. Nat Microbiol. 2024 May.

Erratum in

  • Author Correction: Age-specific nasal epithelial responses to SARS-CoV-2 infection.
    Woodall MNJ, Cujba AM, Worlock KB, Case KM, Masonou T, Yoshida M, Polanski K, Huang N, Lindeboom RGH, Mamanova L, Bolt L, Richardson L, Cakir B, Ellis S, Palor M, Burgoyne T, Pinto A, Moulding D, McHugh TD, Saleh A, Kilich E, Mehta P, O'Callaghan C, Zhou J, Barclay W, De Coppi P, Butler CR, Cortina-Borja M, Vinette H, Roy S, Breuer J, Chambers RC, Heywood WE, Mills K, Hynds RE, Teichmann SA, Meyer KB, Nikolić MZ, Smith CM. Woodall MNJ, et al. Nat Microbiol. 2024 Nov;9(11):3076. doi: 10.1038/s41564-024-01757-z. Nat Microbiol. 2024. PMID: 38890492 Free PMC article. No abstract available.

Abstract

Children infected with SARS-CoV-2 rarely progress to respiratory failure. However, the risk of mortality in infected people over 85 years of age remains high. Here we investigate differences in the cellular landscape and function of paediatric (<12 years), adult (30-50 years) and older adult (>70 years) ex vivo cultured nasal epithelial cells in response to infection with SARS-CoV-2. We show that cell tropism of SARS-CoV-2, and expression of ACE2 and TMPRSS2 in nasal epithelial cell subtypes, differ between age groups. While ciliated cells are viral replication centres across all age groups, a distinct goblet inflammatory subtype emerges in infected paediatric cultures and shows high expression of interferon-stimulated genes and incomplete viral replication. In contrast, older adult cultures infected with SARS-CoV-2 show a proportional increase in basaloid-like cells, which facilitate viral spread and are associated with altered epithelial repair pathways. We confirm age-specific induction of these cell types by integrating data from in vivo COVID-19 studies and validate that our in vitro model recapitulates early epithelial responses to SARS-CoV-2 infection.


Conflict of interest statement

In the past three years, S.A.T. has received remuneration for Scientific Advisory Board Membership from Sanofi, GlaxoSmithKline, Foresite Labs and Qiagen. S.A.T. is a co-founder and holds equity in Transition Bio and Ensocell. Starting 8 January 2024, S.A.T. has been a part-time employee of GlaxoSmithKline. All other authors declare no competing interests.

Figures

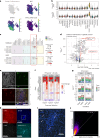
Fig. 1
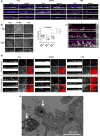
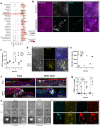
Fig. 1. Characterization of SARS-CoV-2-infected NEC cultures from different age groups.
a, Schematic of method and model used to study SARS-CoV-2 infection of paediatric (P, <12 years), adult (A, 30–50 years) and older adult (O, >70 years) nasal epithelial cells. b, UMAP visualization of annotated airway epithelial cells. Cell numbers per cell type are shown in parentheses. Dotted lines indicate the three principal cell domains these fall within: KRT5 high (KRT5hi), SCGB1A high (SCGB1Ahi) and ciliated/other. UMAP shows the entire single-cell sequencing (scRNA-seq) dataset, including SARS-CoV-2 and mock-infected NEC cultures across all three timepoints and ages (n = P3, A4, O4). c, Percentage of annotated airway epithelial cells with respect to age in baseline (non-infected) NEC cultures and following label transfer to an in vivo dataset of nasal brushings from age-matched donors from ref. (data shown as a percentage cells in the three principal cell domains found in each age group). d, SARS-CoV-2 entry factor protein expression per culture type determined by Western blot. Comparisons of ACE2 and TMPRSS2 protein levels normalized to GAPDH were made using the Wilcoxon test. Individual values plotted for each participant, indicated by dots (n = P9, A7, O8). e, SARS-CoV-2 entry factor gene expression by scRNA-seq. SARS-CoV-2 entry factor gene expression per cell type calculated on the basis of absolute cell numbers, with the average expression of ACE2 and TMPRSS2 indicated by colour. Dot size corresponds to the number of cells expressing ACE2 and TMPRSS2 in respective age groups in the mock condition. f, SARS-CoV-2 RNA viral reads (grey dots, per cell; red dots, per donor) as determined by viral transcript counts (encoding for the full viral genome) per nucleotide per 500 cells (grey dots) or nucleotide per 500 cells per donor (red dots) within each age group. Pairwise comparisons between donors’ age groups were performed using two-sided Wilcoxon rank-sum tests; NS, not significant. g, SARS-CoV-2 viral reads were detected within the scRNA-seq dataset (Infected condition only) at 24 (top) and 72 h (bottom) post infection, shown by cell type and age groups, with dot size and colour indicative of the percentage of cells with detectable viral reads and average reads per cell, respectively. h, Representative maximum intensity z-projections of confocal images (left) of NEC cultures immunolabelled against cilia (cyan, tubulin), dsRNA (yellow) and basal cells (KRT5, white) with DAPI (blue) and phalloidin (magenta) to indicate the nucleus and actin filaments, respectively. Scale bar, 50 μm. Representation of dsRNA signal alone for each section is indicated in red adjacent to respective maximal projections, with the value of spread given on each panel. Summarized on the bar graph to the right (mean ± s.d.), subjected to one-way analysis of variance (ANOVA) with Tukey’s multiple comparisons test. Individual values are shown for each donor (n = P8, A5, O6). A representative orthogonal section is given (bottom right) to indicate location of dsRNA within infected NECs. i,j, Transmission electron micrographs of epithelial cell types infected with SARS-CoV-2, with selected areas of interest shown at a higher magnitude for each; i, ciliated cells (left), goblet cell (middle), transit (right) and j, ciliated 2 cell types. Panels show components of interest within each cell type, denoted by arrows: white arrows, SARS-CoV-2; green arrows, cilia; blue arrows, secretory mucin granules; viral particles false-coloured with red to aid visualization. k, SARS-CoV-2 protein abundance in apical fluid (extracellular) and cell lysates (intracellular) from SARS-CoV-2-infected NECs for 72 h p.i. as determined by mass spectrometry. Data are shown as mean abundance of protein (dot size) and mean fold change (FC) in protein abundance per donor from mock-infected NECs (colour, age group) (n = P5, A5, O5). l, Infectious viral titres in combined cell lysate and apical fluid of SARS-CoV-2 nasal epithelial cells from paediatric, adult and older adult donors as determined by plaque assays (mean ± s.d.). Two-way ANOVA with Tukey’s multiple comparisons test. Individual values are shown for each donor (n = P13, A8, O8). Lines in box and whisker plots (d,f) indicate median, interquartile range (IQR) and minimum to maximum of the distribution. Source data
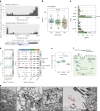
Fig. 2
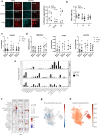
Fig. 2. Cytopathology and cellular changes following SARS-CoV-2 infection of NECs.
a, Representative orthogonal views of the z-stacks showing the thickness (white dashed arrow) and morphology of fixed paediatric, adult and older adult mock- or SARS-CoV-2-infected NECs at 72 h p.i. Sections were immunolabelled against cilia (cyan, tubulin), F-actin (magenta, phalloidin), DAPI (blue), SARS-CoV-2 S protein (yellow) and cytokeratin 5 (white, KRT5+). Solid white arrows indicate cells protruding from the apical surface (as quantified further in e). Scale bar, 50 μm. b, Epithelial thickness was further measured and quantified, and subjected to a two-way ANOVA with Sidak’s multiple comparison test (n = P9, A5, O7). c, Epithelial integrity, as measured by trans-epithelial electrical resistance (TEER) (Ω × cm2) from 72 h p.i. mock- or SARS-CoV-2-infected NECs (n = P11, A4, O7), subjected to multiple paired t-tests. d, Quantification of non-basal KRT5+ cells (for example, KRT5+ cells above and not touching the basal membrane) as a measure of basal cell mobilization, with age and infection (mock vs infection). Calculated using a cross-section of fixed NECs at 72 h p.i. (n = P7, A5, O5), subjected to two-way ANOVA with Tukey’s multiple comparisons test. See Extended Data Fig. 4c,d for more details for analysis. e, Cell protrusion analysis, calculated by counting the number of nuclei (blue, indicated by white solid arrows in a) above apical epithelial membrane (magenta) per section per donor. Data shown as mean ± s.d. (n = P7, A5, O6), subjected to one-way ANOVA with Tukey’s multiple comparisons test. f, Transmission electron micrograph of protruding epithelial cell type, heavily burdened with SARS-CoV-2 virions (red) at 72 h p.i. Scale bar, 2 μm. g, Representative images of immunofluorescence staining for cells that have escaped the pseudostratified position and reside above the apical membrane, as stained in a. Of note here: SARS-CoV-2 spike (yellow) and KRT5 (white). Image 3D-rendered (left) using Imaris (Bitplane) with Blend filter; scale bar, 60 µm. Scale bar for all other images: 5 µm, rendered in ImageJ in right bottom panel, showing a histogram of distance vs fluorescence intensity for DAPI, KRT5 and SARS-CoV-2 spike staining for a single Z-slice indicated by purple dotted line. h, Transmission electron micrograph of epithelial cell shedding (white arrows) at 72 h p.i. with SARS-CoV-2. i,j, UMAP representation of the results from Milo differential abundance (DA) testing (left plot) with nodes showing cell neighbourhoods and Beeswarm plot (right plot) showing the log(FC) observed when comparing SARS-CoV-2-infected versus mock conditions in paediatric i, and older adults j, with a significant enrichment of goblet 2 inflammatory cells and basaloid-like 2 cells, respectively, observed with infection. Beeswarm plot shows the distribution of log(fold change) across annotated cell clusters when comparing SARS versus mock groups, with cell types ranked on the basis of those with the highest fold change. Grey is non-significant, red is significantly increased, blue is significantly decreased at 10% FDR. k, UMAP visualization of annotated epithelial cells from lower and upper airways of 8 in vivo integrated single-cell datasets. Cell numbers per cell type are shown in parentheses. l,m, Graph comparing the frequency of (l) goblet inflammatory and (m) basaloid-like 2 cells normalized to the total number of cells per donor. Each dot represents the ratio of the number of cells multiplied by 1,000 to the total cells contributed from one donor and are coloured on the basis of age_status group. Healthy dataset n = P49, A45, O46; COVID-19 dataset n = P41, A58, O116. Statistical analysis was performed on the normalized proportions using zero-inflated Poisson models using the gamlss package in R. Boxplots show the median and IQR, plus the minimum and maximum value distribution. Note the large frequency of donors with zero incidence. Source data
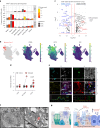
Fig. 3
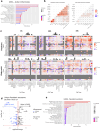
Fig. 3. Paediatric goblet 2 inflammatory cells and interferon expression.
a, UMAP visualization of expression of differentially expressed genes in goblet 2 inflammatory cells. Gene expression is shown in log1p scale. b, Scores of gene ontology (GO) term gene signatures for the terms: response to type 1 interferon (GO:0035455 or GO:0034340) and type 2 interferon (GO:0034341) across cell types. Scores were calculated with Scanpy as the average expression of the signature genes subtracted with the average expression of randomly selected genes from bins of corresponding expression values. Each dot is a cell. c, SARS-CoV-2 entry factor gene expression per cell type calculated on the basis of absolute cell numbers with the average expression of TMPRSS2 (top) and ACE2 (bottom) indicated by colour. Dot size corresponds to infected number of cells expressing TMPRSS2 and ACE2 in respective age groups in the mock (all timepoints) and SARS-CoV-2 (all timepoints) infected condition. d, Volcano plot showing differential gene expression between goblet 2 inflammatory and their precursor goblet 2 PLAU+ cells, with a total of 478 variables. Of note were several genes associated with an interferon response (for example, IFI6, IFITM1, IFIT1, IFIT2 and ISG15) and SARS-CoV-2 viral replication (highlighted in red) which were significantly enriched within the paediatric goblet 2 inflammatory cells. The colours indicate the genes that have adjusted P values ≤0.05 (blue), a log2 fold-change ≥1 or ≤−1 (green), or remain unchanged (grey). The dashed horizontal line signals statistical significance threshold (adjusted P values ≤0.05). Two vertical lines show the threshold of log2 fold-change ≥0.5 and ≤−0.5. e, Visualization of MX1 protein-expressing cells. Maximum intensity projection images of immunofluorescence staining for F-actin (white, phalloidin), MX1 (green), SARS-CoV-2 S protein (red), with DAPI (blue) in composite image. An orthogonal view of the z-stacks is given in the bottom panel. Example given is a SARS-CoV-2-infected paediatric culture at 72 h p.i. Scale bar, 50 µm. f, Fold change in the gene expression in selected IFN genes across all cell types in SARS-CoV-2-infected NECs compared to mock infections in the single-cell datasets. Shown at each timepoint and broken down by age group. Where no expression was seen in the mock infection conditions, fold change was capped at 3 (red). Grey highlights genes that were absent in both conditions. g, Level (pg ml−1) of interferon protein (IFNA, IFNG and IFNL) within the apical supernatant between SARS-CoV-2 and mock-infected NECs. Two-way paired t-test. *P = 0.05, **P < 0.01. (n = P9, O9). h, Representative immunofluorescence images of inflammatory goblet cell markers at 72 h p.i. with SARS-CoV-2. Maximum intensity projection images of immunofluorescence staining in fixed paediatric NECs. Red, DAPI; white, IFNL1; blue, BPIFA1; cyan, SARS-CoV-2 spike (S) protein. i, Higher magnification image of that shown in h with white IFNL1; blue, BPIFA1 (white arrows annotate inflammatory goblet cells). j, Co-localization plot for BPIFA1 and SARS-CoV-2 S protein. Source data
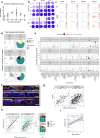
Fig. 4
Fig. 4. Incomplete viral replication in response to IFN signalling in paediatric goblet 2 inflammatory cells.
a, Coverage plot of viral reads aligned to SARS-CoV-2 genome from paediatric ciliated 2 (top) and goblet 2 inflammatory (middle) cells at 72 h p.i. Bottom panel shows the genomic organization of SARS-CoV-2 as drawn using Biorender.com. The sequencing depth was computed for each genomic position for each condition. b, Boxplot depicting the sgRPTL normalized counts for sgRNA abundances across age groups using unpaired t-test. c, The mean ± s.d. distribution of these sgRPTL counts across all genes in paediatric (green) and older adult (brown) NEC cultures, subjected to two-way ANOVA with Sidak’s multiple comparisons test (n = P5, O5). d, Left: frequency of genomic mutations observed in different regions of the SARS-CoV-2 genome. Right: the position and whether an amino acid change was generated from that mutation. Data were generated from 72 h p.i. with SARS-CoV-2 (n = P5, A5, O5). Bin size is 50 bases. Colour blocks indicate the start coordinates of annotated viral genes. e, Number of genomic mutations occurring <16 kb in genome, shown by age group. Data generated from n = P5, A5, O5. f, Hypothesis of SARS-CoV-2-infected goblet 2 PLAU+ cells becoming protective goblet 2 inflammatory cells through increased interferon and defective viral genome production. Drawn using Biorender.com. g, Transmission electron micrographs of goblet cells at 72 h p.i. with SARS-CoV-2 at different magnifications. Scale bar, 2 μm. Viral particles are false-coloured in red and indicated with white arrows. Lines in box and whisker plots (b,e) indicate median, IQR and minimum to maximum of the distribution, with individual values for each cell (b) or NEC culture (e) shown. Source data
Fig. 5
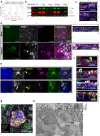
Fig. 5. Elderly basaloid-like 2 cells drive ITGB6 production and enhance viral pathogenesis.
a, Frequency of KRT5hi basal airway epithelial cells in mock (black outline) and SARS-CoV-2-infected (red outline) conditions across all timepoints (4, 24 and 72 h p.i.) with respect to age. Data shown in ratio of cell numbers per 1,000 cells per age group within scRNA-seq dataset, where the colour of the bars indicates fold change (FC) from the matched cell compartment in the mock condition. b, UMAP visualization of expression of differentially expressed genes (ITGB6, KRT5 and Vimentin (VIM)) in basaloid-like 2 cells. Gene expression is shown in log1p scale. c, Volcano plot of differentially expressed proteins in the apical secretome of mock- and SARS-CoV-2-infected cultures that were unique (highly expressed) in the older adult dataset. Blue highlights those that are highly expressed in mock compared with SARS-CoV-2 infection conditions and black are enriched with infection; of note: ITGAV, ITGB6 and TMPRSS2 in red. The red horizontal line signals statistical significance threshold (adjusted P values ≤0.05). Two vertical lines show the threshold of log2 fold-change ≥0.5 and ≤−0.5. d, Analysis of vimentin protein levels by Western blot normalized to GAPDH (n = P5, A9, O9), subjected to multiple paired ratio t-test. e, Representative immunofluorescence images of basaloid-like 2 cell markers in older adults at 72 h p.i. with SARS-CoV-2. Maximum intensity projection images of immunofluorescence staining in fixed older adult NECs. Left: cyan, ITGB6; white, KRT5; yellow, SARS-CoV-2 spike protein; and composite with F-actin (magenta, phalloidin) and DAPI (blue). Right: green, vimentin; F-actin (grey, phalloidin); red, SARS-CoV-2 S protein; and composite with DAPI (blue). White arrows annotate the vimentin cage structure around SARS-CoV-2 S protein. f, Transmission electron micrograph of migrating basal KRT5+ epithelial cell in older adult cultures at 72 h p.i. with SARS-CoV-2 (white arrow). Cytokeratin bundles are indicated (grey arrows) and viral compartments (VC) containing viral particles false-coloured in red. Scale bars, 5 μm (left) and 0.5 μm (right). g, Hypothesis that infection of older adult cells leads to increased shedding of cells heavily burdened with viral particles, which may result in further spread of infection. Repair processes increase KRT5+ and ITGB6+ basaloid-like 2 cells, which are prioritized over the early antiviral responses from goblet 2 inflammatory cells, thereby elevating viral titre. Drawn using Biorender.com. Source data
Fig. 6
Fig. 6. Wound healing upregulates basaloid-like 2 cell markers and associates with increased viral spread.
a, GSEA indicating enriched gene ontology terms for basaloid-like 2 cells obtained using ShinyGo. b, Schematic to show the different wound healing assay protocols. c, Representative immunofluorescence images of basaloid-like 2 cell markers at 24 h post-wound NECs. Top: maximum intensity projection images (left to right): F-actin (grey, phalloidin); yellow, vimentin; and composite with DAPI (blue). Bottom (left to right): white, KRT5; cyan, ITGB6; and composite with F-actin (magenta, phalloidin) and DAPI (blue). Scale bar, 200 µm. Basaloid-like 2 cell markers mean fluorescence signal around wound area. Wound area shown by dotted red outline. df, Analysis of maximal intensity projections of fixed NECs without (−) and with (+) wounds at 24 h post wounding. d, KRT5+ (mean) signal (n = 9; P3, A3, O3). e, Vimentin+ (mean) signal (n = 5; P2, A1, O2). f, ITGB6+ % coverage (n = 10; P4, A4, O2), subjected to ratio paired t-test. Wound healing rate in NECs from different age groups with mock or SARS-CoV-2 infection. g, Percentage wound closure (healed) per hour (% h−1), subjected to two-way ANOVA with Sidak’s multiple comparisons test (n = P8, A5, O4). h, The difference in wound closure per hour between mock and SARS-CoV-2-infected cells from the same donor. Mean ± s.d. (n = P8, A5, O4), subjected to one-way ANOVA with Tukey’s multiple comparisons test. Age variable shown as shape (triangles, adults; circles, paediatric). i, dsRNA coverage for NECs irrespective of age group at 72 h p.i. Determined by percentage area covered with dsRNA signal (yellow) from maximum intensity projections of fixed NECs, subjected to ratio paired t-test (n = 5; P2, A1, O2). j, Representative immunofluorescent images from 72 h p.i. NECs with SARS-CoV-2 without (top) and with (bottom) wounding stained for dsRNA (yellow). Percentage area covered (right) with dsRNA+ signal from maximum intensity projections of fixed NECs using threshold analysis (red) in ImageJ, with the percentage coverage given at the bottom right of each image. k, Representative immunofluorescence images of basaloid-like 2 cell markers ITGB6 (cyan), KRT5 (white), dsRNA (yellow) and F-actin (magenta, phalloidin) in SARS-CoV-2-infected NECs. Maximum intensity projection images from wounded cultures after 24 h, shown both as maximal projections (top) and as an orthogonal view (bottom). KRT5 (white) is omitted from composite images, so that overlap of ITGB6 (cyan) and dsRNA (yellow) is apparent (white). l, Infectious viral titres at 72 h p.i. in combined cell lysate and apical fluid of SARS-CoV-2 nasal epithelial cells from non-wounded (−) and wounded (+) donors that were previously shown to propagate low levels of infectious particles (<10,000 p.f.u. per donor at 72 h p.i.). Infectious viral load in combined apical and cell lysates (p.f.u. per donor) were determined by plaque assays, with representative plaque assay wells shown (bottom). Subjected to paired t-test (n = 8; P6, A2). m, Summary figure highlighting the key findings from the study. Created with BioRender.com. Source data
Extended Data Fig. 1
Extended Data Fig. 1. Paediatric nasal epithelial cells have less basal cell subtypes compared to adult and older adult nasal epithelial cells but display comparable differentiation markers and SARS-CoV-2 entry factor expression.
(a) Violin plot visualization of threshold for percentage of mitochondrial reads in scRNAseq dataset. (b) Uniform manifold approximation and projection (UMAP) visualizations showing good integration of donor IDs, donor pool, treatment, age group, time after infection, 10X Chromium kit version, sex, cell cycle phase and introduced spike-in primer after batch correction (see Methods for more details). (c) Boxplot indicating comparison of cell cycle phase states (G1, G2M, S) amongst the three age groups in mock/infected/combined (All) conditions. (d) Dot plot visualization showing marker genes for annotated airway epithelial cell types, with fraction of expressing cells and average expression within each cell type indicated by dot size and colour, respectively. Broad cell domains are colour coded; KRT5hi (purple), SCGB1A1hi (green) and ciliated/other (yellow). Logistic regression based label transfer using Celltypist for the data sets in (e) Yoshida et al. and (f) Ziegler et al., with fraction of matched cells and average probability score indicated by dot size and colour, respectively (g) Numbers of annotated airway epithelial cells in respect to age (data shown in ratio of cell numbers/per 1000 cells in age dataset). (h) Representative maximum intensity z-projections of confocal images (left and central) and transmission electron micrographs (right panels) of NEC cultures differentiated at an air–liquid interface and immunolabeled against cilia (tubulin, green) and mucin (MUC5AC, red), with DAPI (blue) and phalloidin (grey) to indicate the nucleus and actin filaments, respectively. Scale bar 10-μm applies to all images in the row. Source data
Extended Data Fig. 2
Extended Data Fig. 2. Physiological differences in paediatric, adult and older adult nasal epithelial NEC cultures.
Physiological comparison of paediatric (P), adult (A) and older adult (O) NEC cultures as measure by; (a) ciliary beat frequency (CBF)(Hz) (n = P6, A6, O7); (b) the percentage of +ve ɑ-tubulin staining coverage per 225 μm2 section (n = P6, A4, O5); (c) motility measured by percentage scratch closure over time (n = P8, A3, O8) and (d) culture thickness (n = P9, A5, O7). For (a-d) data was plotted as mean ± SD, subject to one-way ANOVA with Tukey’s multiple comparison test (e) Representative light microscope images of whole well scans of NEC cultures depicting the characteristic differences in culture morphology with age (P=Paed, A=Adult, E=Older adult). (f) Comparison of epithelial integrity via trans-epithelial electrical resistance (TEER) (Ω.cm2). Mean ± SD (n = P12, A8, O8) plotted across the age groups using one-way ANOVA with Tukey’s correction. (g) Alternate SARS-CoV-2 entry factor gene expression per cell type calculated based upon absolute cell numbers with the average expression of BSG, CTSL, NRP1, NRP2 and FURIN indicated by colour. Dot size corresponds to the total number of cells expressing alternate viral entry genes in respective age groups in the mock condition. (h) Palantir inferred probabilities of cycling basal cells differentiating into basaloid-like 2 or goblet 2 inflammatory cells. (i) Boxplot showing the distribution of pseudotime within each cluster among goblet cell subtypes. (j) Palantir inferred probabilities of cycling basal cells differentiating into basaloid-like 2 cells. (k) Boxplot showing the distribution of pseudotime within each cluster among KRT5hi cell subtypes. Lines in box and whisker plots i, j indicates median, interquartile range, and minimum to maximum of the distribution, with individual values for each cell shown. Source data
Extended Data Fig. 3
Extended Data Fig. 3. Elderly cells replicate more infectious viruses with a greater distribution of viral reads across epithelial subtypes.
(a) Mean viral replication shown as pfu/ml per donor over a 5-day period (n = 35: P15, A10, O10). (b) Exemplar image of plaque assay used to determine infectious viral load. (c) UMAP of airway cells with detected SARS-CoV2 mRNA in each cell type in cultures mock and SARS-CoV-2 infected for all time points and ages combined (≥1 viral UMI per donor following filtering out ambient RNA). (d) Pie charts showing the fractions of annotated airway epithelial cells containing viral reads at 4 h, 24 h and 72 h p.i. in respect to age. (e) Numbers of annotated airway epithelial cells containing viral reads at 24 h and 72 h post infection (red) in respect to age with total number of cells in each subset (grey) (data shown as cell numbers/per 1000 cells in age dataset). (f) Representative orthogonal views of z-stacks from fixed paediatric (top), adult (middle) and older adult (bottom) NECs at 72 h p.i. with SARS-CoV-2. Sections were immunolabeled against F-actin (phalloidin, grey) DAPI (blue) and SARS-CoV-2 S protein (red). The scale bar represents 10 μm. (g) Linear regression analysis of viral reads vs ACE2 and TMPRSS2 expression per cell at 72 h post infection. Data represents all age groups combined (h) Linear regression analysis of viral reads vs ACE2 and TMPRSS2 expression per cell and grouped by cell domains (i) Linear regression of infectious viral titres in combined cell lysate and apical fluid of SARS-CoV-2 nasal epithelial cells from donors of different ages as determined by plaque assays (n = 29). Subject to Pearson correlation with SE shown for line error. Source data
Extended Data Fig. 4
Extended Data Fig. 4. Minimal cytopathology following SARS-CoV-2 infection of NECs.
(a) Orthogonal views of the z-stacks showing the thickness and morphology from fixed paediatric, adult and older adult NECs from 3 separate donors at 72 h p.i. mock or SARS-CoV-2 infected NEC cultures. Sections were immunolabeled against cilia (tubulin, cyan), F-actin (phalloidin, magenta) DAPI (blue), SARS-CoV-2 S protein (yellow) and cytokeratin 5 (KRT5+, white). Scale bar = 50 µm. (b) Representative maximal intensity projections (top panels) and orthogonal z sections (bottom panels) of NECs stained for E-Cadherin at 72 h p.i. with mock or SARS-CoV-2 (scale bar 50 μm) and expression determined via Western blots and normalised to GAPDH. Data plotted as mean ± SD, subject to one-way ANOVA with Tukey’s multiple comparison test, with individual values shown (n = P5, A5, O5). (c) Representative orthogonal views of the z-stacks showing the localisation of KRT5+ve cells (white) from example NEC cultures (summary in Fig. 2d). KRT5+ve cells above the horizontal yellow line are classified as non-basal -layer (not in contact with basement membrane), F-actin (phalloidin, magenta) stain references apical membrane and tight-junctions. Each section is 225 µm in width. (d) Maximal projections of the z-stacks showing the localisation of KRT5+ve cells (white) from above and below the horizontal yellow line (classified as non-basal -layer) from example air–liquid interface cultures at 72 h p.i. with mock or SARS-CoV-2 (scale bar 50 μm). (e) Transmission electron micrograph of epithelial cell shedding (white arrows) at 72 h p.i. with SARS-CoV-2 (scale bar 10 μm). Source data
Extended Data Fig. 5
Extended Data Fig. 5. Cytopathology and changes in cell types.
(a) Cilia coverage for each age group at 72 h p.i. Mock and SARS-CoV-2. (left) Representative Immunofluorescent images from 72 h p.i. NECs with mock and SARS-CoV-2 condition stained for a-tubulin (cyan) (scale bar = 50 µm). Percentage area covered (right) with αTubulin+ve signal (cyan) from maximum intensity projections of fixed NECs using threshold analysis (red) in ImageJ. Summary of cilia coverage (right) (n = P5, A4, O5). Subject to one-way ANOVA with Tukey’s multiple comparison test. For 72 h p.i. (mock and SARS-CoV-2 conditions) NECs were compared between age groups, looking at average (b) cilia beat frequency (Hz) (n = P8, A8, O8); (c) α-Tubulin protein expression (n = P11, A8, O7) and (d) SARS-CoV-2 entry factor protein expression (ACE2, TMPRSS2 and short ACE2). Protein levels were determined via Western blot and normalised to GAPDH (n = P6-8, A5-9, O5-8). Data for b-d plotted as mean ± SD, with individual values shown. (e) Total numbers of annotated airway epithelial cells in all mock infected vs all SARS-CoV-2 infected datasets in respect to age (data shown in ratio of cell numbers/per 1000 cells in age dataset) (n = P3, A4, O4). (f) Dot plots showing the log-fold change in SARS-CoV-2 versus mock at different time points for all cell types in different age groups. Calculation based upon absolute cell numbers with the average fold-change indicated by colour. The dot size corresponds to the number of that cell type per 1000 cells from each condition. (g) Uniform manifold approximation and projection (UMAP) representation of the results from Milo differential abundance testing. Nodes are neighbourhoods, coloured by their log fold change when comparing SARS-CoV-2 infected versus mock conditions in adult samples. Non-significant DA neighbourhoods at FDR 10% are coloured grey and significant DA neighbourhoods at FDR 10% are coloured with increased log fold change in red and decreased log fold change in blue. Node sizes correspond to the number of cells in a neighbourhood. The layout of nodes is determined by the position of the neighbourhood index cell in the UMAP. (h) Palantir inferred pseudotime probabilities of cycling basal cells differentiating into ciliated 1, basaloid-like 2 or goblet 2 inflammatory cells. Source data
Extended Data Fig. 6
Extended Data Fig. 6. Basaloid-like cells were predominantly found in COVID-19 older adult patients in vivo.
(a) Dot plot visualisation showing marker genes for annotated epithelial cell types in the integrated in vivo single cell dataset (Fig. 2k), with fraction of expressing cells and average expression within each cell type indicated by dot size and colour, respectively. Normalised goblet inflammatory cells (b) and basaloid-like 2 cells (c) per total of 5000 cells per age group in all paediatric, adult, and older adult subgroups. PF = pulmonary fibrosis, IPF = idiopathic pulmonary fibrosis. (Healthy dataset n = P49, A45, O46; COVID19 dataset n = P41, A58, O116). Source data
Extended Data Fig. 7
Extended Data Fig. 7. Paediatric goblet 2 inflammatory cells and viral truncation in response to IFN signalling.
(a) Gene Set Enrichment Analysis (GSEA) of HVGs from goblet inflammatory cells indicating enriched gene ontology terms using ShinyGo. (b) Correlation matrix of a subset of interferon genes expressed by all paediatric or older adult cells at 72 h post SARS-CoV-2 infection as determined using the function cor_pmat() in ggcorrplot and Pearson correlation method. (c) ISG gene expression in SARS-CoV-2 infected cultures (as log-fold change compared to mock) per cell type at 4 h, 24 and 72 h p.i. for paediatric and older adult datasets. Barplot indicates the number of cells at each time point. Grey = not detected (d) Volcano plot showing differential expressed proteins of the apical secretome between mock and SARS-CoV-2 infected cultures that were unique (highly expressed) in the paediatric cohort. Blue highlights those that are highly expressed in mock compared to SARS-CoV-2 infection conditions and black enriched with infection. (e) GSEA for expression of apical secretome genes of paediatric cells at 72 h p.i. with SARS-CoV-2 obtained using ShinyGo. The data in a,b,c relates the scRNAseq dataset (n = P3, A4, O4), whilst d and e uses data generated through the analysis of the collected apical secretome (n = P5, A5, O5). Source data
Extended Data Fig. 8
Extended Data Fig. 8. Viral truncation in response to IFN signaling.
Coverage plots of viral reads aligned to SARS-CoV-2 genome in each cell type in (a) paediatric, (b) adult (c) and older adult infected NECs grouped across all time points. Coverage plots of viral reads aligned to SARS-CoV-2 genome for all cell types, shown by age group, both (d) with and (e) without spiked-in primer grouped across all timepoints (see methods for more details of primer) and at (f) 72 h p.i. time points. Viral reads for all coverage plots are shown in 100 nucleotide (nt) bins normalised per 5,000 cells. The data in a-f relates to the scRNA-seq dataset (n = P3, A4, O4). (g) Histogram displaying frequency and position of genomic mutations in SARS-CoV-2 consensus sequences from 72 h p.i. with SARS-CoV-2 (n = P5, A5, O5). Bin size is 1000 bases (left) and 50 bases (right). Colour blocks indicate the start coordinates of annotated viral genes. Source data
Extended Data Fig. 9
Extended Data Fig. 9. Elderly basaloid-like 2 cells drive ITGB6 production and enhance viral pathogenesis.
(a) Abundance of ITGB6 protein in the apical secretome of mock or SARS-CoV-2 infected NECs at 72 h p.i. for each age group (n = P5, A5, O5). As detected using mass spectrometry and shown in boxplot depicting the median and IQR, plus the minimum and maximum value distribution analysed using paired t test. (b) Exemplar Western blot showing vimentin (vim) in the older adult sample 72 h p.i. with mock (-) or SARS-CoV-2 (+) and 72 h p.i. Vero E6 cells as control lysate (ctl). GAPDH is the loading control, E-Cadherin is also given for reference (n = P2, A1, O1). (c) Orthogonal views of the z-stacks showing the location of ITGB6 (green) and KRT5+ve cells (white) from exemplar air–liquid interface cultures, counterstained for F-actin (phalloidin, red) and cell nucleus (DAPI, blue). (d) Representative maximum intensity projections (left) and orthogonal sections (right) of immunofluorescence z-stacks of basaloid-like 2 cell markers ITGB6 (green), KRT5 (white), spike (magenta) counterstained for F-actin (phalloidin; red) and cell nucleus (DAPI, blue) in 72 h p.i. NECs (mock top, infected bottom). (e-g) Further, example immunofluorescence images of basaloid-like 2 cell markers in 72 h p.i. with SARS-CoV-2 in older adult NEC cultures. Markers and respective counterstain colour are indicated (n = O3). (h) Transmission electron micrograph of non-basal KRT5+ve epithelial cell (white arrow) location within an NEC culture at 72 h p.i. with SARS-CoV-2. Scale is on the right of the image. For panels c-h, representative images were selected from older adult NEC cultures (n = 3) 72 hours post-infection (p.i.) with SARS-CoV for each antibody panel. Source data
Extended Data Fig. 10
Extended Data Fig. 10. Wound repair promotes SARS-CoV-2 viral replication.
(a) Dotplot visualisation showing viral entry genes for all cell types, with fraction of expressing cells and average expression within each cell type indicated by dot size and colour, respectively. Appended bar graphs indicate absolute cell numbers per cell type. Data generated using the entire scRNAseq dataset (n = P3, A4, O4). (b) Example immunofluorescence orthogonal sections of basaloid-like 2 cell markers in unwounded or wounded older adult NECs 24 h p.i. with mock or SARS-CoV-2 infection. F-actin (Phalloidin; red), KRT5 (white), ITGB6 (cyan) and DAPI (blue). (c) Mean ± SD KRT5 fluorescence signal (RFU) around wound area in different age groups. From maximal projections of fixed NECs without (-) and with (+) wounds, 24 h post wounding (n = P3, A3, O3) (n = 6). (d) Maximum intensity projection image of a NEC culture unwounded and 24 h post wound. F-actin (Phalloidin; white), Vimentin (VIM) (yellow) and DAPI (blue). (e) Mean ± SD Vimentin fluorescence signal (RFU) around wound area in different age groups. From maximal projections of fixed NECs without (-) and with (+) wounds, 24 h post wound (n = P2, A1, O2). (f) Example immunofluorescence orthogonal sections of basaloid-like 2 cell markers in non-wounded or wounded NECs 24 h p.i. with mock or SARS-CoV-2 infection from a paediatric and older adult donor. Stained for F-actin (Phalloidin; red), ITGB6 (green), SARS-CoV-2 Spike protein (magenta), KRT5 (white) and composite with DAPI (blue). (g) Mean ± SD ITGB6 fluorescence signal (RFU) around wound area in different age groups. From maximal projections of fixed NECs without (-) and with (+) wounds, 24 h post wounding (n = P3, A3-4, O3-2). (h) Example of wound healing images taken of NECs from different age groups and with mock or SARS-CoV-2 infection. Acquired by light microscopy over 24 hours. The scale bar (bottom right) represents 1 mm. (i) Representative immunofluorescence images from 72 h p.i. NECs with SARS-CoV-2 without (-) and with (+) wounding stained for ITGB6 (cyan) and dsRNA (yellow). Percentage area covered (right) with ITGB6+ve or dsRNA+ve signal from maximum intensity projections of fixed NECs using threshold analysis (red) in ImageJ, the percentage coverage is given at the bottom right of each image. For c,e,g the average values for each NEC donor are shown and are subject to a two-way ANOVA with Sidak’s multiple comparisons test. For panels b, d, f, g, i a minimum of 5 experiments (ranging from n = 5–10) were conducted for each antibody panel, from which representative images were selected. Source data

References

    1. Lu X, et al. SARS-CoV-2 infection in children. N. Engl. J. Med. 2020;382:1663–1665. doi: 10.1056/NEJMc2005073. - DOI - PMC - PubMed
    1. Yanez, N. D., Weiss, N. S., Romand, J.-A. & Treggiari, M. M. COVID-19 mortality risk for older men and women. BMC Public Health20, 1742 (2020). - PMC - PubMed
    1. Sungnak W, et al. SARS-CoV-2 entry factors are highly expressed in nasal epithelial cells together with innate immune genes. Nat. Med. 2020;26:681–687. doi: 10.1038/s41591-020-0868-6. - DOI - PMC - PubMed
    1. Ahn, J. H. et al. Nasal ciliated cells are primary targets for SARS-CoV-2 replication in the early stage of COVID-19. J. Clin. Invest. 131, e148517 (2021). - PMC - PubMed
    1. Chen, J. et al. Nonmuscle myosin heavy chain IIA facilitates SARS-CoV-2 infection in human pulmonary cells. Proc. Natl Acad. Sci. USA118, e2111011118 (2021). - PMC - PubMed

Publication types

MeSH terms