. 2024 Apr 15;22(1):355.
doi: 10.1186/s12967-024-05152-4.

Polygenic risk score-based phenome-wide association for glaucoma and its impact on disease susceptibility in two large biobanks

Collaborators, Affiliations

Polygenic risk score-based phenome-wide association for glaucoma and its impact on disease susceptibility in two large biobanks

Jae-Seung Yun et al. J Transl Med. .

Abstract

Background: Glaucoma is a leading cause of worldwide irreversible blindness. Considerable uncertainty remains regarding the association between a variety of phenotypes and the genetic risk of glaucoma, as well as the impact they exert on the glaucoma development.

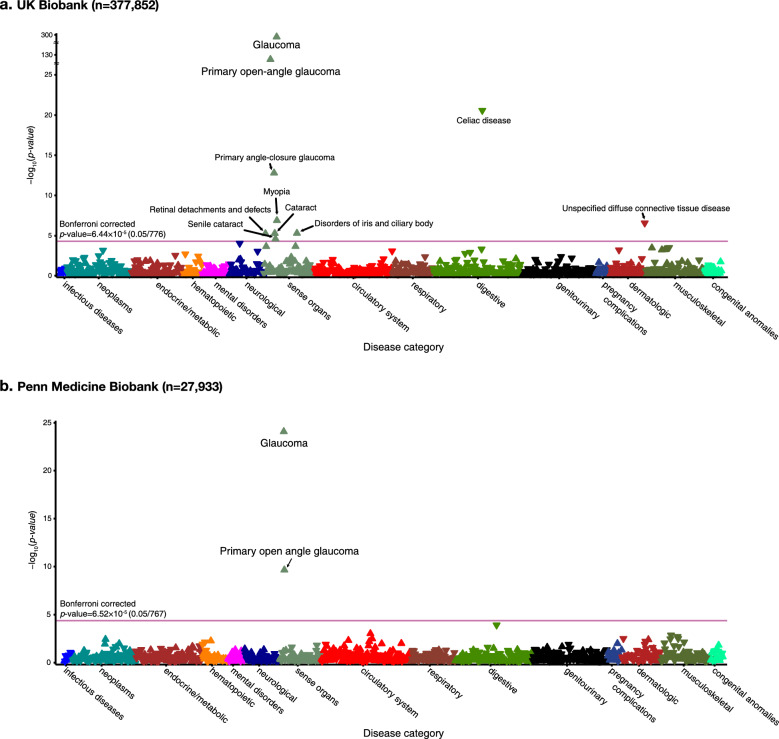
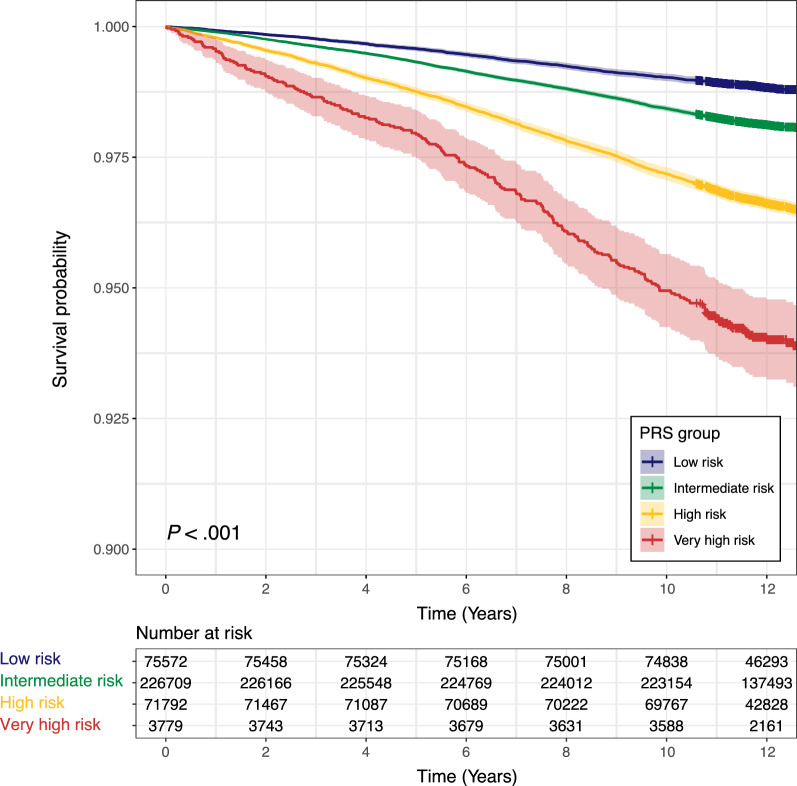
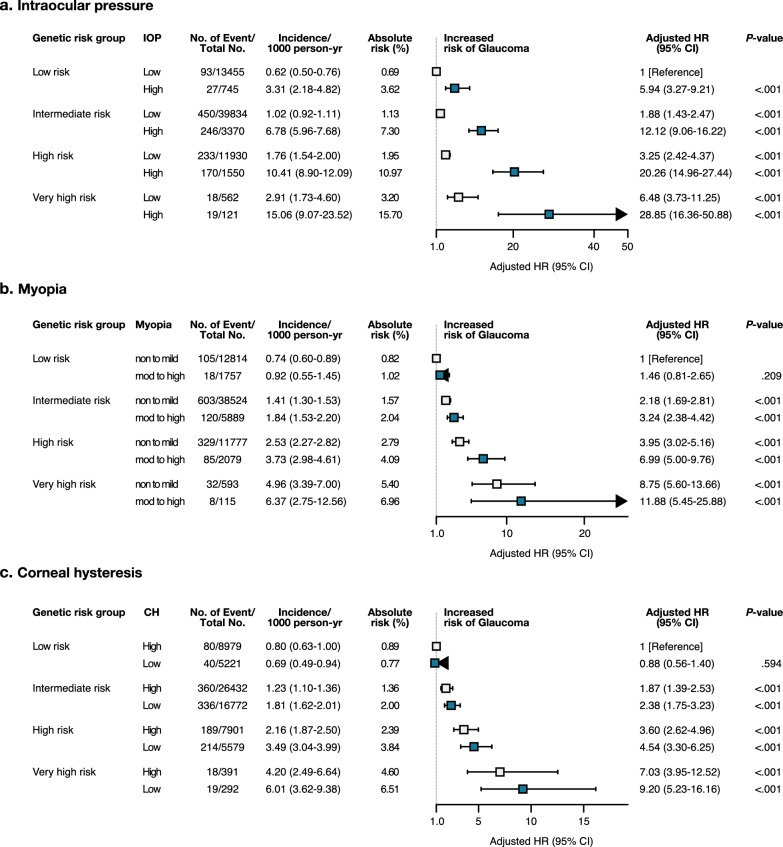
Methods: We investigated the associations of genetic liability for primary open angle glaucoma (POAG) with a wide range of potential risk factors and to assess its impact on the risk of incident glaucoma. The phenome-wide association study (PheWAS) approach was applied to determine the association of POAG polygenic risk score (PRS) with a wide range of phenotypes in 377, 852 participants from the UK Biobank study and 43,623 participants from the Penn Medicine Biobank study, all of European ancestry. Participants were stratified into four risk tiers: low, intermediate, high, and very high-risk. Cox proportional hazard models assessed the relationship of POAG PRS and ocular factors with new glaucoma events.

Results: In both discovery and replication set in the PheWAS, a higher genetic predisposition to POAG was specifically correlated with ocular disease phenotypes. The POAG PRS exhibited correlations with low corneal hysteresis, refractive error, and ocular hypertension, demonstrating a strong association with the onset of glaucoma. Individuals carrying a high genetic burden exhibited a 9.20-fold, 11.88-fold, and 28.85-fold increase in glaucoma incidence when associated with low corneal hysteresis, high myopia, and elevated intraocular pressure, respectively.

Conclusion: Genetic susceptibility to POAG primarily influences ocular conditions, with limited systemic associations. Notably, the baseline polygenic risk for POAG robustly associates with new glaucoma events, revealing a large combined effect of genetic and ocular risk factors on glaucoma incidents.


Conflict of interest statement

The authors have no funding and competing interests to disclose.

Figures

Fig. 1
Fig. 1
Density (A) and prevalence plot (B) according to the PRS distribution for POAG (n = 377, 852)
Fig. 2
Fig. 2
Significance plot for all phenotypes for POAG PRS, grouped by disease categories from discovery set and replication set. A Significance plot for all phenotypes for POAG PRS, grouped by disease categories from UK Biobank. PheCodes are organized and plotted by disease category on the x-axis, and the y-axis represents the − log10 of uncorrected P values of two-sided test for linear regression between POAG PRS and each of the phenotype. Each point represents a single PheCode, and the color indicates their corresponding categories. The horizontal line is marked at the Bonferroni threshold of significance for multiple testing (P < 5.21 × 10−5). The representative significant associations in each category are annotated in the figure. The direction of each arrowhead corresponds to increased risk (up) or decreased risk (down). The discovery samples consist of 377,852 participants in the UK Biobank and the exact sample size for each phenotype are presented in Additional file 2. B Significance plot for all phenotypes for POAG-PRS, grouped by disease categories from Penn Medicine Biobank (replication sample). PheCodes are organized and plotted by category on the x-axis, and the y-axis represents the − log10 of uncorrected P values of two-sided test for linear regression between POAG PRS and each of the phenotype. Each point represents a single PheCode, and the color indicates their corresponding categories. The horizontal red line is marked at the Bonferroni threshold of significance for multiple testing (P < 6.52 × 10−5). The representative significant associations in each category are annotated in the figure. The direction of each arrowhead corresponds to increased risk (up) or decreased risk (down). The replication samples consist of 27,933 participants and the exact sample size for each phenotype is presented in Additional file 2 .
Fig. 3
Fig. 3
Kaplan–Meier survival curves according to categories of a polygenic risk score for primary open-angle glaucoma (POAG). The probability of survival over time for various genetic risk groups was significantly different (P < 0.001, Log-rank test)
Fig. 4
Fig. 4
Forest plot of hazard ratio according to genetic risk and ocular risk factors (n = 73,548). Cox regression model was adjusted for age, sex, genotyping array, first 10 genetic principal components of ancestry, BMI, income, smoking status, systolic and diastolic blood pressure, low-density lipoprotein, HbA1c, and use of hypertensive medication. High intraocular pressure (IOP) was defined as having value of ≥ 21 mmHg, and myopia as having a spherical equivalent of ≤ -0.5D, and low corneal hysteresis (CH) as having value of ≤ 10.1 mmHg

References

    1. Zhang N, Wang J, Li Y, et al. Prevalence of primary open angle glaucoma in the last 20 years: a meta-analysis and systematic review. Sci Rep. 2021;11:13762. doi: 10.1038/s41598-021-92971-w. - DOI - PMC - PubMed
    1. Charlesworth J, Kramer PL, Dyer T, et al. The path to open-angle glaucoma gene discovery: endophenotypic status of intraocular pressure, cup-to-disc ratio, and central corneal thickness. Invest Ophthalmol Vis Sci. 2010;51:3509–3514. doi: 10.1167/iovs.09-4786. - DOI - PMC - PubMed
    1. Polubriaginof FCG, Vanguri R, Quinnies K, et al. Disease heritability inferred from familial relationships reported in medical records. Cell. 2018;173:1692–1704.e1611. doi: 10.1016/j.cell.2018.04.032. - DOI - PMC - PubMed
    1. Wang K, Gaitsch H, Poon H, et al. Classification of common human diseases derived from shared genetic and environmental determinants. Nat Genet. 2017;49:1319–1325. doi: 10.1038/ng.3931. - DOI - PMC - PubMed
    1. Asefa NG, Neustaeter A, Jansonius NM, et al. Heritability of glaucoma and glaucoma-related endophenotypes: systematic review and meta-analysis. Surv Ophthalmol. 2019;64:835–851. doi: 10.1016/j.survophthal.2019.06.002. - DOI - PubMed

Publication types

LinkOut - more resources