. 2024 Mar 27;27(4):109608.
doi: 10.1016/j.isci.2024.109608. eCollection 2024 Apr 19.

Vascular endothelial cells-derived exosomes synergize with curcumin to prevent osteoporosis development

Affiliations

Vascular endothelial cells-derived exosomes synergize with curcumin to prevent osteoporosis development

Jiaojiao Wang et al. iScience. .

Abstract

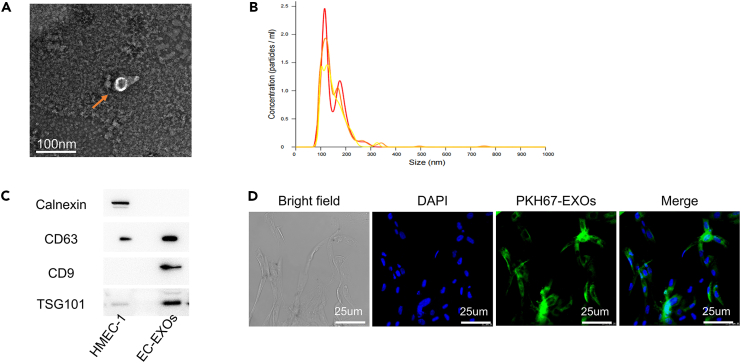
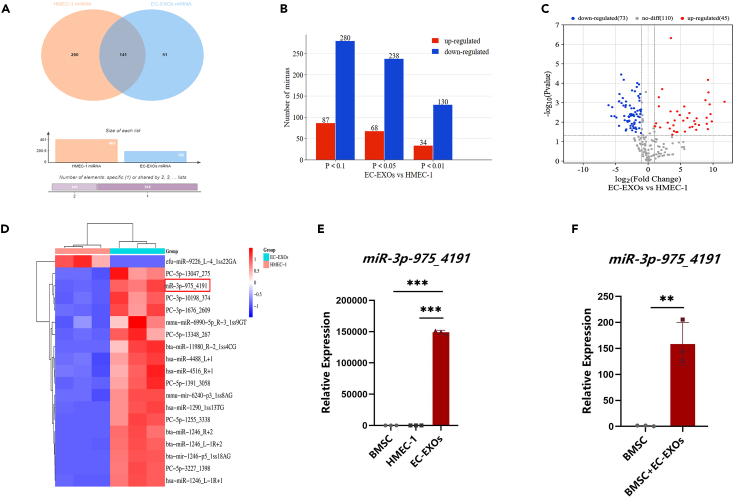
Osteoporosis has gradually become a major public health problem. Further elucidation of the pathophysiological mechanisms that induce osteoporosis and identification of more effective therapeutic targets will have important clinical significance. Experiments in vitro on bone marrow stem cells (BMSCs) subjected to osteogenic and adipogenic differentiation and in vivo on surgical bilateral ovariectomy (OVX) mouse models revealed that exosomes of vascular endothelial cells (EC-EXOs) can promote osteogenic differentiation of BMSCs and inhibit BMSC adipogenic differentiation through miR-3p-975_4191. Both miR-3p-975_4191 and curcumin can target tumor necrosis factor (TNF) and act synergistically to regulate BMSCs fate differentiation and delay the progression of osteoporosis. Our findings suggest that EC-EXOs may exert a synergistic effect with curcumin in reversing the progression of osteoporosis by targeting TNF via miR-3p-975_4191. Our study may provide therapeutic options and potential therapeutic targets for osteoporosis and thus has important clinical implications.

Keywords: Cell biology; Orthopedics; Stem cells research.


Conflict of interest statement

The authors declare no competing interests.

Figures

None
Graphical abstract
Figure 1
Figure 1
Characterization of exosomes derived from HMEC-1 cells (A) EC-EXOs observed by transmission electron microscopy (scale bar: 100 nm). (B) The particle sizes of exosomes were analyzed. (C) Western blotting was performed to detect the expression of the exosomal markers CD63, CD9 and TSG101. (D) The internalization of PKH26-labeled exosomes by BMSCs was observed under a fluorescence microscope.
Figure 2
Figure 2
EC-EXOs can promote osteogenic differentiation and inhibit adipogenic differentiation of BMSCs (A) Representative images of Alizarin red staining after 21 days of osteogenic induction and (B) quantification of calcification of BMSCs among different groups. Scale bar, 100 μm. (C–G) The mRNA expression levels of osteogenic biomarkers (OPN, RUNX2, OCN, OC, and OSTERIX) in osteogenically differentiated BMSCs in different groups on Day 7 were detected by RT-qPCR. (H) Oil red O staining and (I) quantification of BMSCs among the different groups after adipogenic induction for 14 days. Scale bar, 100 μm. (J–L) The mRNA expression levels of adipogenic biomarkers (mPparg, CD36, and Cebpα) in adipogenically differentiated BMSCs in different groups on Day 7 were detected by RT-qPCR. β-Actin was used as an internal control. The values were expressed as mean ± SEM, ∗p < 0.05, ∗∗p < 0.01, ∗∗∗p < 0.001.
Figure 3
Figure 3
EC-EXOs increase bone formation and reduce bone marrow fat accumulation in aged mice (A) Representative μCT images. Scale bar: 1 mm. (B) 3D reconstruction figures of representative μCT. (C–F) Quantitative analysis of the trabecular bone microarchitecture in the distal femurs of 15-month-old mice treated with PBS or EC-EXOs (BV/TV, Tb.N, Tb.Sp, and Tb.Th). (G) Representative images of HE-stained heart, liver, spleen, lung, and kidney sections from 15-month-old mice treated with PBS or EC-EXOs. Scale bars: 50 μm. (H) Representative images of HE staining of the distal femurs of 15-month-old mice treated with EC-EXOs or PBS and (I) quantification of the number of adipocytes associated with the tissue area (N.adipocytes/T.Ar) in the distal femur. Scale bar: 50 μm. (J) Representative images of OCN staining and (K) quantification of osteoblast bone surface density (N.Ob/B.Pm) in the distal femurs of 15-month-old mice treated with PBS or EC-EXOs. Scale bar: 50 μm. (L) Representative images of TRAP staining and (M) quantification of osteoclast bone surface density (N.Oc/B.Pm) in the distal femurs of 15-month-old mice treated with EC-EXOs or PBS. Scale bar: 50 μm. The values were expressed as mean ± SEM, ∗p < 0.05, ∗∗p < 0.01, ∗∗∗p < 0.001.
Figure 4
Figure 4
EC-EXOs promote bone formation and reduce fat formation in OVX mice (A) Representative images of sham-operated mice and OVX mice. (B) Representative μCT images. Scale bar: 1 mm. (C) 3D reconstruction figures of representative μCT. (D–G) Quantitative analysis of the trabecular bone microarchitecture in sham-operated mice and OVX mice treated with PBS or EC-EXOs (BV/TV, Tb.N, Tb.Sp, and Tb.Th). (H) Representative images of HE-stained heart, liver, spleen, lung, and kidney sections from sham-operated mice and OVX mice treated with PBS or EC-EXOs. Scale bars: 50 μm. (I) Representative images of HE staining of the distal femurs of sham-operated mice and OVX mice treated with PBS or EC-EXOs and (J) quantification of the number of adipocytes associated with the tissue area (N.adipocytes/T. Ar) in the distal femur. Scale bar: 50 μm. (K) Representative images of OCN staining and (L) quantification of the osteoblast bone surface density (N.Ob/B.Pm) in the distal femurs of sham-operated mice and OVX mice treated with PBS or EC-EXOs. Scale bar: 50 μm. (M) Representative images of TRAP staining and (N) quantification of osteoclast bone surface density (N.Oc/B.Pm) in the distal femurs of sham-operated mice and OVX mice treated with PBS or EC-EXOs. Scale bar: 50 μm. The values were expressed as mean ± SEM, ∗p < 0.05, ∗∗p < 0.01, ∗∗∗p < 0.001.
Figure 5
Figure 5
Identification of differentially expressed miRNAs between HMEC-1 cells and EC-EXOs (A) Venn diagram showing the overlap of shared miRNAs in HMEC-1 cells and EC-EXOs. (B) Histogram showing the number of differentially expressed miRNAs between HMEC-1 cells and EC-EXOs. Blue and red indicate downregulation and upregulation, respectively. (C) Volcano plot of sequencing analysis of miRNAs differentially expressed between HMEC-1 cells and EC-EXOs. Blue and red indicate downregulation and upregulation, respectively. (D) Heatmap of cluster analysis of differential expression of miRNAs between HMEC-1 cells and EC-EXOs. miRNA expression is presented as the log10(norm value). Red indicates strongly expressed genes, and blue indicates weakly expressed genes. (E) Expression of miR-3p-975_4191 in BMSCs, HMEC-1 cells and EC-EXOs as verified by RT-qPCR. (F) Expression of miR-3p-975_4191 in BMSCs and BMSCs treated with EC-EXOs as verified by RT-qPCR. The values were expressed as mean ± SEM, ∗p < 0.05, ∗∗p < 0.01, ∗∗∗p < 0.001.
Figure 6
Figure 6
Overexpression of miR-3p-975_4191 can promote osteogenic differentiation and inhibit adipogenic differentiation of BMSCs (A) The overexpression of miR-3p-975_4191 in BMSCs after gene transfection was verified by RT-qPCR. Representative images of Alizarin red staining after 21 days of osteogenic induction (B) and quantification of calcification (C) of BMSCs after overexpression of miR-3p-975_4191. Scale bar, 100 μm. (D–I) The mRNA expression levels of osteogenic biomarkers (ALP, POSTN, OC, COL1, BMP8a and BSP) in osteogenically differentiated BMSCs after overexpression of miR-3p-975_4191 on Day 7 were detected by RT-qPCR. Oil red O staining (J) and quantification (K) of BMSCs after 14 days of adipogenic induction after overexpression of miR-3p-975_4191. Scale bar, 100 μm. (L–N) The mRNA expression levels of adipogenic biomarkers (mPparg, CD36, and Cebpα) in adipogenically differentiated BMSCs in different groups after overexpression of miR-3p-975_4191 on Day 7 were detected by RT-qPCR. β-Actin was used as an internal control. The values were expressed as mean ± SEM, ∗p < 0.05, ∗∗p < 0.01, ∗∗∗p < 0.001.
Figure 7
Figure 7
Knockdown of miR-3p-975_4191 can inhibit osteogenic differentiation and promote adipogenic differentiation of BMSCs (A) Knockdown of miR-3p-975_4191 in BMSCs after gene transfection was verified by RT-qPCR. Representative images of Alizarin red staining after 21 days of osteogenic induction (B) and quantification of calcification (C) of BMSCs after knockdown of miR-3p-975_4191. Scale bar, 100 μm. (D–G) The mRNA expression levels of osteogenic biomarkers (RUNX2, BMP2, BSP, and COL1) in osteogenically differentiated BMSCs after knockdown of miR-3p-975_4191 on Day 7 were detected by RT-qPCR. Oil red O staining (H) and quantification (I) of BMSCs after 14 days of adipogenic induction after knockdown of miR-3p-975_4191. Scale bar, 100 μm. (J–O) The mRNA expression levels of adipogenic biomarkers (mPparg, mFabp4, CD36, Hdipq, ID4, and LPL) in adipogenically differentiated BMSCs in different groups after knockdown of miR-3p-975_4191 on Day 7 were detected by RT-qPCR. β-Actin was used as an internal control. The values were expressed as mean ± SEM, ∗p < 0.05, ∗∗p < 0.01, ∗∗∗p < 0.001.
Figure 8
Figure 8
TNF is a potential target gene for miR-3p-975_4191 (A) Venn diagram showing the shared target genes of miR-3p-975_4191 and osteoporosis. (B) The corresponding GO annotations of the selected miRNA target genes were determined, and the GO functions of each class were ranked from highest to lowest according to the number of annotated target genes. The horizontal coordinate is the enrichment score, and the vertical coordinate is the GO classification. The circle diagram shows the biological process (C), cell component (D) and molecular function (E) terms associated with the miR-3p-975_4191 target genes. (F) PPI network map of the shared target genes of miR-3p-975_4191 and osteoporosis, excluding nodes without protein interactions. The confidence level was 0.9. (G) PPI network diagram optimized by Cytoscape software. (H) Hub network diagram of the top 10 core target genes based on the MCC algorithm. (I) The expression of TNF after overexpression of miR-3p-975_4191 was verified by RT-qPCR. (J) The expression of TNF protein was detected by western blot after overexpression of miR-3p-975_4191. (K) The potential binding sites for miR-3p-975_4191 on the 3′UTR of TNF. (L) BMSCs were transfected with a luciferase reporter vector containing either the WT or mutant plasmid of the 3′UTR of TNF. The values were expressed as mean ± SEM, ∗p < 0.05, ∗∗p < 0.01, ∗∗∗p < 0.001.
Figure 9
Figure 9
Curcumin can inhibit adipogenic differentiation of BMSCs (A) Construction of a Chinese medicine monomer active ingredient-TNF signaling pathway-osteoporosis network using Cytoscape. (B) Two-dimensional diagram of the interaction of curcumin with TNF. (C) Visualization of the molecular docking of curcumin with TNF in 3D. (D) CCK-8 assay to analyze the cytotoxicity of curcumin. (E) Oil red O staining and (F) quantification of BMSCs after adipogenic induction for 14 days among different groups. Scale bar, 100 μm. (G–J) The mRNA expression levels of adipogenic biomarkers (mFabp4, mPparg, Cebpα, and GPD1) in adipogenically differentiated BMSCs in different groups on Day 7 were detected by RT-qPCR. β-Actin was used as an internal control. The values were expressed as mean ± SEM, ∗p < 0.05, ∗∗p < 0.01, ∗∗∗p < 0.001.
Figure 10
Figure 10
Curcumin combined with EC-EXOs synergistically promotes osteogenic differentiation and inhibits adipogenic differentiation of BMSCs (A) Representative images of Alizarin red staining after 21 days of osteogenic induction and (B) quantification of calcification of BMSCs among different groups. Scale bar, 100 μm. (C–E) mRNA expression levels of osteogenic biomarkers (ALP, OPN, and OC) in osteogenically differentiated BMSCs in different groups on Day 7 were detected by RT-qPCR. (F) Oil red O staining and (G) quantification of BMSCs after adipogenic induction for 14 days among different groups. Scale bar, 100 μm. (H–J) The mRNA expression levels of adipogenic biomarkers (mFabp4, mPparg, and Cebpα) in adipogenically differentiated BMSCs in different groups on Day 7 were detected by RT-qPCR. β-Actin was used as an internal control. The values were expressed as mean ± SEM, ∗p < 0.05, ∗∗p < 0.01, ∗∗∗p < 0.001.

Similar articles

Cited by

References

    1. Fang Y., Zhu J., Fan J., Sun L., Cai S., Fan C., Zhong Y., Li Y. Dietary Inflammatory Index in relation to bone mineral density, osteoporosis risk and fracture risk: a systematic review and meta-analysis. Osteoporos. Int. 2021;32:633–643. doi: 10.1007/s00198-020-05578-8. - DOI - PubMed
    1. Cauley J.A. Osteoporosis: fracture epidemiology update 2016. Curr. Opin. Rheumatol. 2017;29:150–156. doi: 10.1097/bor.0000000000000365. - DOI - PubMed
    1. Peng Y., Wu S., Li Y., Crane J.L. Type H blood vessels in bone modeling and remodeling. Theranostics. 2020;10:426–436. doi: 10.7150/thno.34126. - DOI - PMC - PubMed
    1. Biswas L., Chen J., De Angelis J., Singh A., Owen-Woods C., Ding Z., Pujol J.M., Kumar N., Zeng F., Ramasamy S.K., Kusumbe A.P. Lymphatic vessels in bone support regeneration after injury. Cell. 2023;186:382–397.e324. doi: 10.1016/j.cell.2022.12.031. - DOI - PubMed
    1. Maes C., Kobayashi T., Selig M.K., Torrekens S., Roth S.I., Mackem S., Carmeliet G., Kronenberg H.M. Osteoblast precursors, but not mature osteoblasts, move into developing and fractured bones along with invading blood vessels. Dev. Cell. 2010;19:329–344. doi: 10.1016/j.devcel.2010.07.010. - DOI - PMC - PubMed

LinkOut - more resources