. 2024 Mar 27;27(4):109601.
doi: 10.1016/j.isci.2024.109601. eCollection 2024 Apr 19.

Genomic analysis of human brain metastases treated with stereotactic radiosurgery reveals unique signature based on treatment failure

Affiliations

Genomic analysis of human brain metastases treated with stereotactic radiosurgery reveals unique signature based on treatment failure

Jack M Shireman et al. iScience. .

Abstract

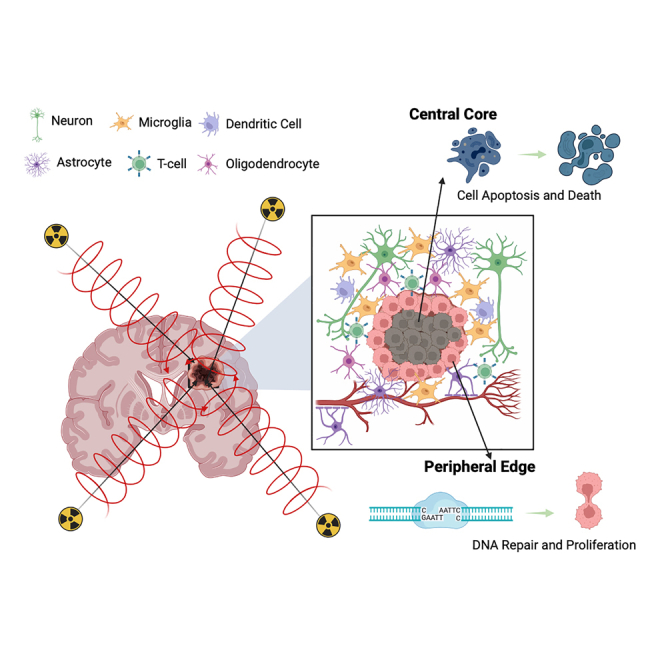
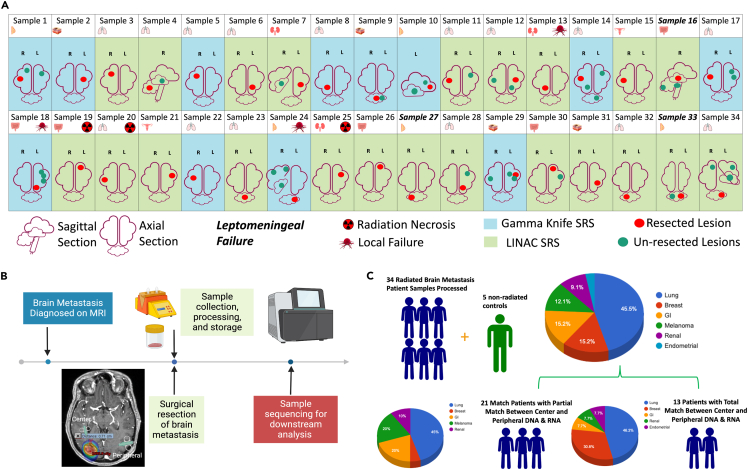
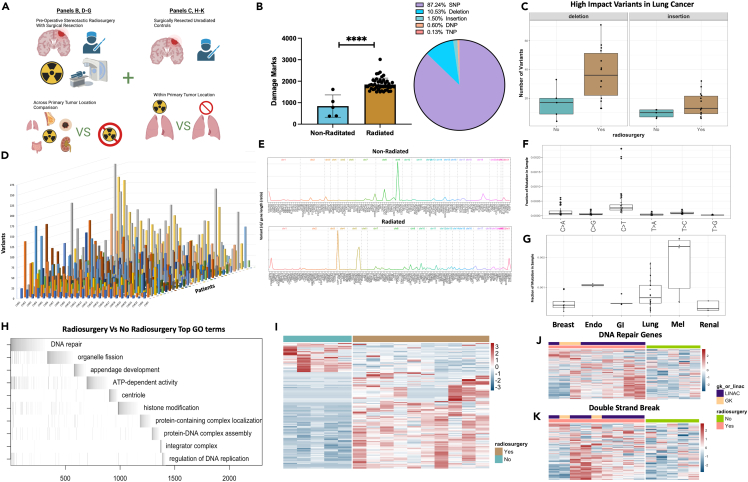
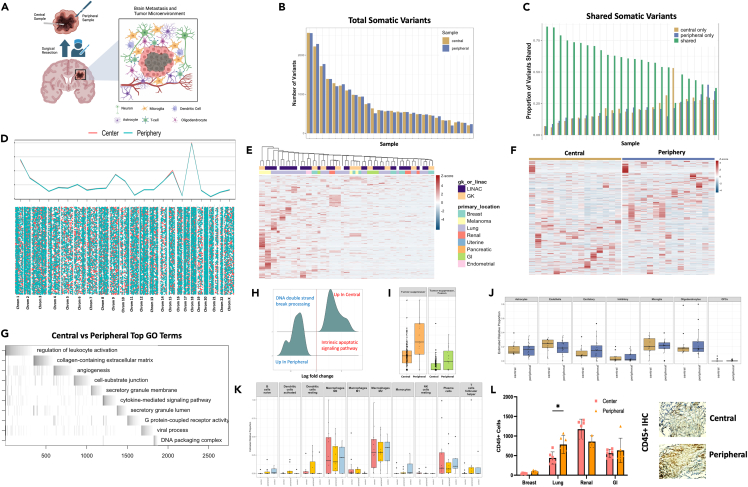
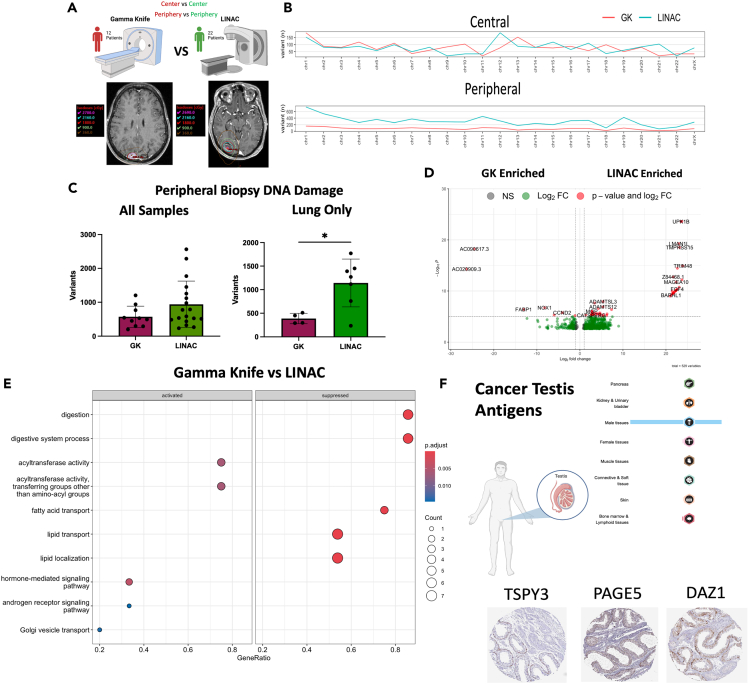
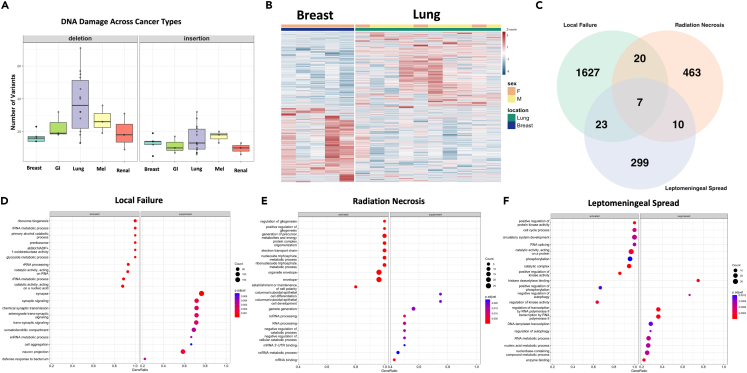
Stereotactic radiosurgery (SRS) has been shown to be efficacious for the treatment of limited brain metastasis (BM); however, the effects of SRS on human brain metastases have yet to be studied. We performed genomic analysis on resected brain metastases from patients whose resected lesion was previously treated with SRS. Our analyses demonstrated for the first time that patients possess a distinct genomic signature based on type of treatment failure including local failure, leptomeningeal spread, and radio-necrosis. Examination of the center and peripheral edge of the tumors treated with SRS indicated differential DNA damage distribution and an enrichment for tumor suppressor mutations and DNA damage repair pathways along the peripheral edge. Furthermore, the two clinical modalities used to deliver SRS, LINAC and GK, demonstrated differential effects on the tumor landscape even between controlled primary sites. Our study provides, in human, biological evidence of differential effects of SRS across BM's.

Keywords: Cancer; Cancer systems biology; Genomic analysis; Genomics.


Conflict of interest statement

The authors declare no competing interests.

Figures

None
Graphical abstract
Figure 1
Figure 1
Sample characteristics (A) Characteristics of the 34 patients analyzed. (B) Timeline of sample collection and processing. (C) Breakdown of type of primary tumor location across all samples collected and analyzed.
Figure 2
Figure 2
SRS incudes DNA damage resulting in genome wide transcriptomic changes in treated tumor tissue (A) Schematic depicting analysis of samples with and without radiosurgery compared between common primary tumor locations (lung) or across primary tumor locations. (B) Quantification of total damage marks and type of damage detected by variant calling between radiated and non-radiated samples. (C) Comparison of high-impact deletions or insertions among radiated and non-radiated lung cancer samples. (D) 3D plot of all samples organized by chromosome (x), number of variants detected (y), and patient (z). (E) Chromosome visualization plot of mutated genes across non-radiated and radiated samples. (F) Single base substitutions present in radiated samples. (G) Single base substitutions present grouped by primary tumor location across radiated samples. (H) ALLEZ GSEA waterfall plot with previous term exclusion applied to genes differentially expressed among tumors metastasized from lung. (I) Heatmap visualization of differentially expressed genes among non-radiated samples (left/blue) and radiated samples from tumors metastasized from lung (right/brown). (J) Heatmap visualizing the expression of genes associated with GO term “DNA Repair” among non-radiated and radiated tumors metastasized from lung. (K) Heatmap visualizing the expression of genes associated with GO term “Double-Strand Break” among non-radiated and radiated tumors metastasized from lung. Error bars indicate SD. Comparison between samples done using students t-test (B), differential expression analysis was done within DESeq2 or ALLEZ using adjusted p value <0.05 (H, I, J, K). ∗∗∗∗p < 0.0001.
Figure 3
Figure 3
Peripheral edges of brain metastasis show signs of DNA damage repair and enrichment of cellular growth genes, likely contributing to treatment failure (A) Schematic depicting the isolation of central and peripheral tumor samples as well as the components of the CNS microenvironment seen by the peripheral BM cells. (B) Quantification of total somatic variants detected among central and peripheral biopsy locations. (C) Quantification of shared or unique somatic variants detected among central and peripheral biopsy locations. (D) Chromosome level visualization of variants from central or peripheral biopsy locations summed (top) or individualized (later in discussion). (E) Heatmap visualization of variants per gene per sample among all central and peripheral biopsy locations across primary tumor location and SRS delivery modality. (F) Heatmap of differential isoform enrichment analyses conducted by DIFFUSE across central and peripheral biopsy locations. (G) ALLEZ GSEA waterfall plot with previous term exclusion conducted on differentially expressed isoforms between central and peripheral biopsy locations. (H) GSEA of differentially expressed genes using ClusterProfiler between central and peripheral biopsy locations restricted to terms included in DNA damage or repair. (I) Quantification of mutations on genes annotated to be tumor suppressors across central and peripheral biopsy locations. (J) FARDEEP deconvolution analysis using brain cell type references conducted on central and peripheral biopsy locations. (K) FARDEEP deconvolution analysis using immune cell type references conducted on central and peripheral biopsy locations. (L) in vitro visualization of CD45+ cell invasion using IHC on central and peripheral tumor biopsy locations. Error bars indicate SD. Statistical comparisons between groups were conducted with ANOVA with Bonferroni correction (L). Differential expression analysis was done within DESeq2, ALLEZ, ClusterProfiler, and DIFFUSE using adjusted p value <0.05 (E, F, G, H, I). ∗p < 0.05.
Figure 4
Figure 4
Gamma Knife and LINAC treatment modalities induce differential genomic signatures and DNA damage across matched primary tumor types (A) Schematic depicting comparison between GK and LINAC treated samples with representative images for dose contouring on individual patients. (B) Chromosome visualization of mutations between GK and LINAC treated samples across central and peripheral biopsy locations. (C) Quantification of total variants detected among peripheral samples between GK and LINAC SRS delivery. (D) Volcano plot of DESeq2 determined differentially expressed genes between GK and LINAC treated samples. (E) GSEA enrichment of DE genes when compared across GK and LINAC dosing modality. (F) Visualization of enriched CTA genes using Human Protein Atlas data. Error bars indicate SD. Differential expression analysis was done within DESeq2 using adjusted p value <0.05 ∗p < 0.05.
Figure 5
Figure 5
Primary tumor location and types of treatment failure display distinct genomic profiles (A) Visualization of insertion or deletion high-impact variants detected among all primary tumor locations. (B) Heatmap displaying differentially expressed genes between BM” s of breast of lung primary tumor origin. (C) Overlap between DE gene sets found in patients with LF/LMF/RN. (D) GSEA enrichment conducted on DE genes in patients with LF. (E) GSEA enrichment conducted on DE genes in patients with RN. (F) GSEA enrichment conducted on DE genes in patients with LMF. Error bars indicate SD. Differential expression analysis and visualization was done within DESeq2 andClusterProfiler, and using adjusted p value <0.05.

References

    1. Ostrom Q.T., Cioffi G., Gittleman H., Patil N., Waite K., Kruchko C., Barnholtz-Sloan J.S. CBTRUS Statistical Report: Primary Brain and Other Central Nervous System Tumors Diagnosed in the United States in 2012–2016. Neuro Oncol. 2019;21:v1–v100. doi: 10.1093/neuonc/noz150. - DOI - PMC - PubMed
    1. Suh J.H., Kotecha R., Chao S.T., Ahluwalia M.S., Sahgal A., Chang E.L. Current approaches to the management of brain metastases. Nat. Rev. Clin. Oncol. 2020;17:279–299. doi: 10.1038/s41571-019-0320-3. - DOI - PubMed
    1. Moravan M.J., Fecci P.E., Anders C.K., Clarke J.M., Salama A.K.S., Adamson J.D., Floyd S.R., Torok J.A., Salama J.K., Sampson J.H., et al. Current multidisciplinary management of brain metastases. Cancer. 2020;126:1390–1406. doi: 10.1002/cncr.32714. - DOI - PubMed
    1. Brown P.D., Ballman K.V., Cerhan J.H., Anderson S.K., Carrero X.W., Whitton A.C., Greenspoon J., Parney I.F., Laack N.N.I., Ashman J.B., et al. Postoperative stereotactic radiosurgery compared with whole brain radiotherapy for resected metastatic brain disease (NCCTG N107C/CEC·3): a multicentre, randomised, controlled, phase 3 trial. Lancet Oncol. 2017;18:1049–1060. doi: 10.1016/s1470-2045(17)30441-2. - DOI - PMC - PubMed
    1. Soliman H., Das S., Larson D.A., Sahgal A. Stereotactic radiosurgery (SRS) in the modern management of patients with brain metastases. Oncotarget. 2016;7:12318–12330. doi: 10.18632/oncotarget.7131. - DOI - PMC - PubMed