. 2024 May 13;64(9):3779-3789.
doi: 10.1021/acs.jcim.4c00136. Epub 2024 Apr 16.

AutoDock-SS: AutoDock for Multiconformational Ligand-Based Virtual Screening

Affiliations

AutoDock-SS: AutoDock for Multiconformational Ligand-Based Virtual Screening

Boyang Ni et al. J Chem Inf Model. .

Abstract

Ligand-based virtual screening (LBVS) can be pivotal for identifying potential drug leads, especially when the target protein's structure is unknown. However, current LBVS methods are limited in their ability to consider the ligand conformational flexibility. This study presents AutoDock-SS (Similarity Searching), which adapts protein-ligand docking for use in LBVS. AutoDock-SS integrates novel ligand-based grid maps and AutoDock-GPU into a novel three-dimensional LBVS workflow. Unlike other approaches based on pregenerated conformer libraries, AutoDock-SS's built-in conformational search optimizes conformations dynamically based on the reference ligand, thus providing a more accurate representation of relevant ligand conformations. AutoDock-SS supports two modes: single and multiple ligand queries, allowing for the seamless consideration of multiple reference ligands. When tested on the Directory of Useful Decoys─Enhanced (DUD-E) data set, AutoDock-SS surpassed alternative 3D LBVS methods, achieving a mean AUROC of 0.775 and an EF1% of 25.72 in single-reference mode. The multireference mode, evaluated on the augmented DUD-E+ data set, demonstrated superior accuracy with a mean AUROC of 0.843 and an EF1% of 34.59. This enhanced performance underscores AutoDock-SS's ability to treat compounds as conformationally flexible while considering the ligand's shape, pharmacophore, and electrostatic potential, expanding the potential of LBVS methods.


Conflict of interest statement

The authors declare no competing financial interest.

Figures
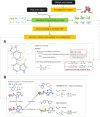
Figure 1
Figure 1
Basic workflow of AutoDock-SS, supporting both a single query ligand and multiple query ligands. Ligand-based grid maps are generated for the single query ligand or the superimposition of multiple query ligands, which are then fed into the AutoDock-GPU for virtual screening. The best pose is extracted and the similarity score is calculated. (A) 2D representation of grid points from a carbon map and corresponding pseudospheres that, along with eq 1, are used to calculate the pseudopotential value of this point for a specific atom type. A list of all atom types considered in shown in Table S1. (B) Example demonstrating the use of eq 3 to normalize the Sinit for an active compound and a decoy. The ball-and-stick structure represents the reference ligand 5AXC-ARJ, and the structure in magenta is the reference ligand itself. The left bottom corner shows the reference ligand self-docking into its own maps (not shown) to obtain the Sref. The two structures on the right exemplify the best conformations extracted, their corresponding Sinit, and how their Sinit values are normalized to the Ssim.
Figure 2
Figure 2
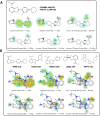
(A) Reference ligand-based grid maps (affinity maps) generated for different atom types of 3L3M-A92. The affinity map for the fluorine atom is not presented here as it is in the same single-atom format as the OA map. (B) Grid maps based on the superposition of five aligned ligands. For each affinity map, the corresponding atom type is labeled on each atom. The affinity maps have a gradient based on the distance to the atom and the number of atoms in the pseudosphere. The deeper the color, the more favored the region for that atom type.
Figure 3
Figure 3
Electrostatic potential map of the ligand ChEMBL1089125, with atomic partial charges labeled on all atoms. The blue regions with gradient represent the preferred areas for negatively charged atoms, and different shades stand for different levels of preference (the deeper, the more preferred). The red regions indicate the preferred areas for positively charged atoms; a gradient for these areas is not presented here.
Figure 4
Figure 4
Cluster of 102 ROCs from the evaluation of AutoDock-SS single reference mode performance in screening all DUD-E targets. The orange boxplot on the right represents the distribution of AUROC values, and the blue one shows the distribution of EF1% values. The red line in the boxplot indicates the median value, and the green triangle represents the mean value.
Figure 5
Figure 5
Examples of AutoDock-SS single-reference mode performance compared with alternative methods. Ball-and-stick structures represent the reference ligand, and cyan structures represent example actives. The average and median molecular weights and heavy atom counts of the actives library are displayed. The gray surface represents the area of the ensemble of grid maps (i.e., areas where grid maps have negative pseudopotential values).
Figure 6
Figure 6
Example of different predictions made by the multireference mode and the single-reference mode based on the superimposition of five reference ligands and a single reference ligand, respectively. The yellow structure shows the best conformation predicted by the single-reference mode, and the cyan structure was predicted based on the mutual alignment of the five ligands. The ball-and-stick structures represent the reference ligands and the superimposition of five query ligands. The additional features presented in the multireference mode are highlighted. The AUROC value for each DUD-E+ ligand is indicative of the performance of the multireference complexed by that ligand and the default DUD-E ligand.

References

    1. Gimeno A.; Ojeda-Montes M. J.; Tomás-Hernández S.; Cereto-Massagué A.; Beltrán-Debón R.; Mulero M.; et al. The light and dark sides of virtual screening: What is there to know?. Int. J. Mol. Sci. 2019, 20, 1375.10.3390/ijms20061375. - DOI - PMC - PubMed
    1. Geppert H.; Vogt M.; Bajorath J. Current Trends in Ligand-Based Virtual Screening: Molecular Representations, Data Mining Methods, New Application Areas, and Performance Evaluation. J. Chem. Inf. Model. 2010, 50, 205–216. 10.1021/ci900419k. - DOI - PubMed
    1. Yuriev E.; Ramsland P. A. Latest developments in molecular docking: 2010–2011 in review. J. Mol. Recognit. 2013, 26, 215–239. 10.1002/jmr.2266. - DOI - PubMed
    1. Cereto-Massagué A.; Ojeda M. J.; Valls C.; Mulero M.; Garcia-Vallvé S.; Pujadas G. Molecular fingerprint similarity search in virtual screening. Methods 2015, 71, 58–63. 10.1016/j.ymeth.2014.08.005. - DOI - PubMed
    1. Melville J.; Burke E.; Hirst J. Machine Learning in Virtual Screening. Comb. Chem. High Throughput Screening 2009, 12, 332–343. 10.2174/138620709788167980. - DOI - PubMed

Publication types