

A Predictive Model for the Evolution of COVID-19
- PMID: 38624436
- PMCID: PMC7306451
- DOI: 10.1007/s41403-020-00130-w
A Predictive Model for the Evolution of COVID-19
Abstract
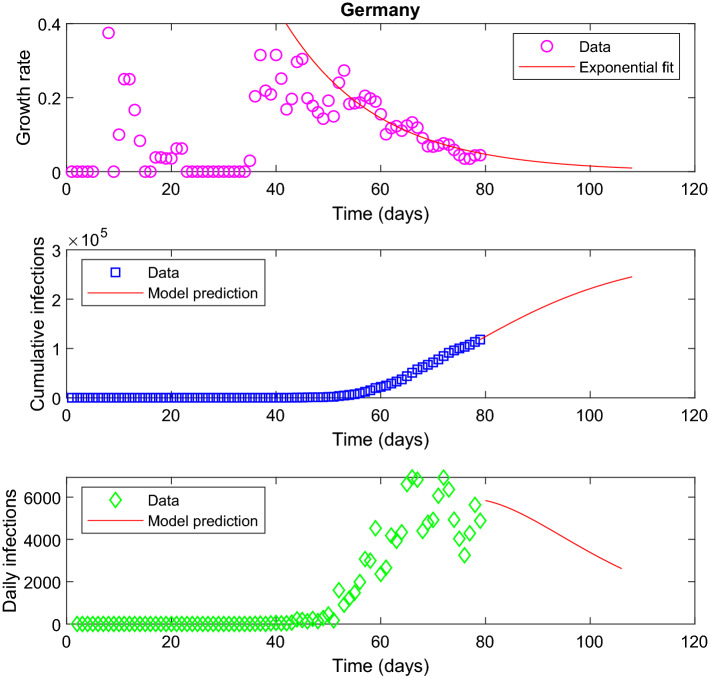
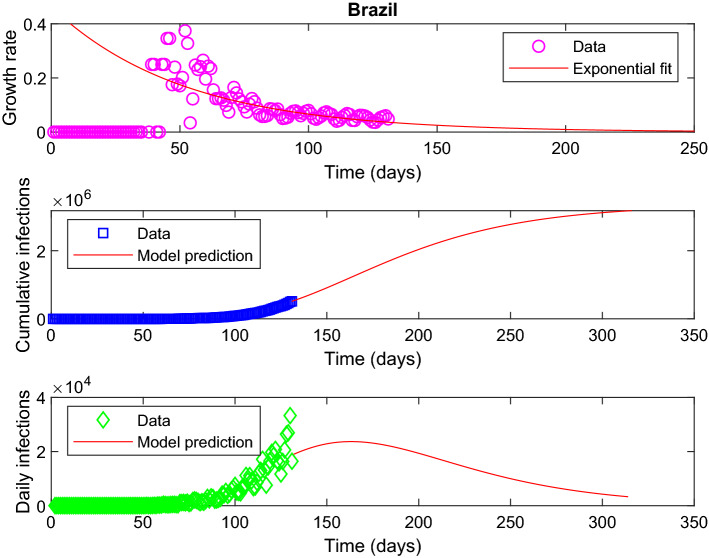
We predict the evolution of the COVID-19 pandemic in several countries using a logistic model. The model uses a regression analysis based on the least-squares fitting. In particular, the growth rate of the infection has been fitted as an exponential decay, as compared to a linear decay, reported previously in logistic models. The model has been validated with the data of China and South Korea, where the pandemic is nearing to its end. The data of Italy, Germany, Spain, and Sweden show that the peak of the infection has been reached, i.e. a time when the new infections will start to decrease as compared to the previous day. The model predicts the approximate number of total infections at the end of the outbreak. The possible peak date and the total number of infections for different countries are predicted using the data available. The total number of infections in the USA is estimated to be around 4 million. The model prediction of Brazil shows that the peak will reach on 5 July 2020 and total infections will be 3.2 million. The reported data of India show a large initial scatter in the growth rate. The total number of infections in India is estimated to be around 2.4 million by the model and the predicted peak date is 3 August 2020. The predictions of India are discussed in the context of restricted movement of population, i.e. lock-down imposed by the government.
Keywords: COVID-19; Epidemiology; Logistic model.
© Indian National Academy of Engineering 2020.
Figures


References
-
- Batista M (2020) Estimation of the final size of the COVID-19 epidemic. medRxiv preprint. 10.1101/2020.02.16.20023606
-
- Quadrat J-P (2020) A simple COVID-19 epidemic model and containment policy in france. medRxiv preprint. 10.1101/2020.04.25.20079434
-
- Ranjan R (2020) Predictions for COVID-19 outbreak in India using epidemiological models. medRxiv preprint. 10.1101/2020.04.02.20051466
-
- Renshaw E (1993) Modelling biological populations in space and time, vol 11. Cambridge University Press, Cambridge
LinkOut - more resources
Full Text Sources