

Mathematical modeling applied to epidemics: an overview
- PMID: 38624924
- PMCID: PMC8482738
- DOI: 10.1007/s40863-021-00268-7
Mathematical modeling applied to epidemics: an overview
Abstract
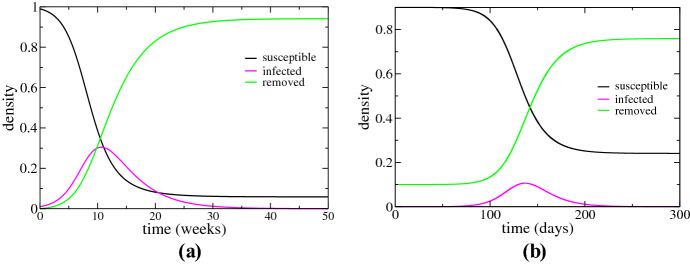
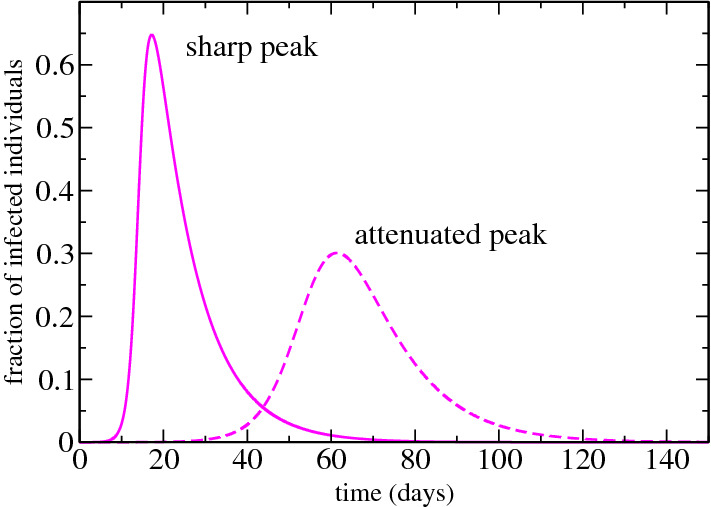
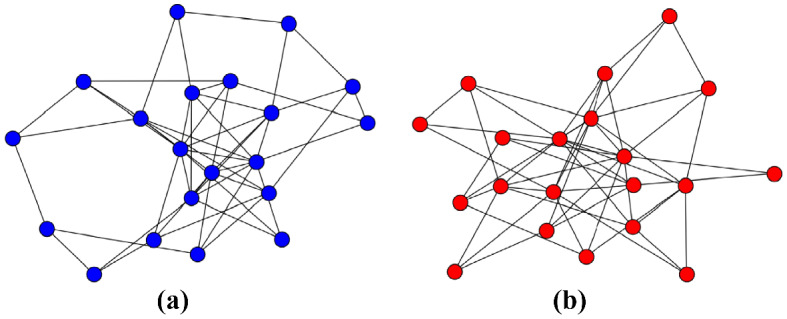
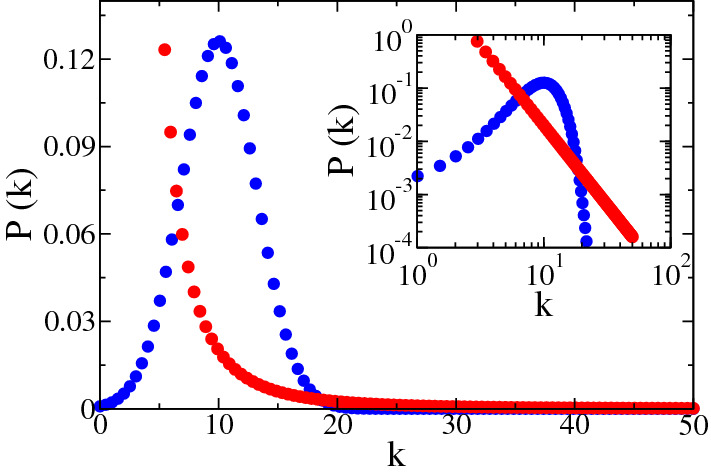
This work presents an overview of the evolution of mathematical modeling applied to the context of epidemics and the advances in modeling in epidemiological studies. In fact, mathematical treatments have contributed substantially in the epidemiology area since the formulation of the famous SIR (susceptible-infected-recovered) model, in the beginning of the 20th century. We presented the SIR deterministic model and we also showed a more realistic application of this model applying a stochastic approach in complex networks. Nowadays, computational tools, such as big data and complex networks, in addition to mathematical modeling and statistical analysis, have been shown to be essential to understand the developing of the disease and the scale of the emerging outbreak. These issues are fundamental concerns to guide public health policies. Lately, the current pandemic caused by the new coronavirus further enlightened the importance of mathematical modeling associated with computational and statistical tools. For this reason, we intend to bring basic knowledge of mathematical modeling applied to epidemiology to a broad audience. We show the progress of this field of knowledge over the years, as well as the technical part involving several numerical tools.
Keywords: Complex networks; Disease spreading; Epidemic; Mathematical modeling; Public health; SIR model.
© Instituto de Matemática e Estatística da Universidade de São Paulo 2021.
Conflict of interest statement
Conflict of interestThe authors declare there is no conflict of interest.
Figures
Similar articles
-
Modeling and tracking Covid-19 cases using Big Data analytics on HPCC system platformm.J Big Data. 2021;8(1):33. doi: 10.1186/s40537-021-00423-z. Epub 2021 Feb 15. J Big Data. 2021. PMID: 33614394 Free PMC article.
-
Modeling Epidemics Spreading on Social Contact Networks.IEEE Trans Emerg Top Comput. 2015 Sep;3(3):410-419. doi: 10.1109/TETC.2015.2398353. Epub 2015 Sep 4. IEEE Trans Emerg Top Comput. 2015. PMID: 27722037 Free PMC article.
-
Simulation applications to support teaching and research in epidemiological dynamics.BMC Med Educ. 2022 Aug 20;22(1):632. doi: 10.1186/s12909-022-03674-3. BMC Med Educ. 2022. PMID: 35987608 Free PMC article.
-
Modeling epidemics: A primer and Numerus Model Builder implementation.Epidemics. 2018 Dec;25:9-19. doi: 10.1016/j.epidem.2018.06.001. Epub 2018 Jul 13. Epidemics. 2018. PMID: 30017895 Review.
-
Mathematical and computational approaches to epidemic modeling: a comprehensive review.Front Comput Sci (Berl). 2015;9(5):806-826. doi: 10.1007/s11704-014-3369-2. Epub 2015 Oct 9. Front Comput Sci (Berl). 2015. PMID: 32288946 Free PMC article. Review.
Cited by
-
A time evolving online social network generation algorithm.Sci Rep. 2023 Feb 10;13(1):2395. doi: 10.1038/s41598-023-29443-w. Sci Rep. 2023. PMID: 36765153 Free PMC article.
-
Using compartmental models and Particle Swarm Optimization to assess Dengue basic reproduction number R 0 for the Republic of Panama in the 1999-2022 period.Heliyon. 2023 Apr 13;9(4):e15424. doi: 10.1016/j.heliyon.2023.e15424. eCollection 2023 Apr. Heliyon. 2023. PMID: 37128312 Free PMC article.
-
A Century of Mathematical Epidemiology: A Bibliometric Analysis and Visualization of Research Trends.Cureus. 2024 Oct 7;16(10):e71001. doi: 10.7759/cureus.71001. eCollection 2024 Oct. Cureus. 2024. PMID: 39507146 Free PMC article. Review.
-
A data-driven analysis on the mediation effect of compartment models between control measures and COVID-19 epidemics.Heliyon. 2024 Jun 29;10(13):e33850. doi: 10.1016/j.heliyon.2024.e33850. eCollection 2024 Jul 15. Heliyon. 2024. PMID: 39071698 Free PMC article.
-
Mathematical appraisal of SARS-CoV-2 Omicron epidemic outbreak in unprecedented Shanghai lockdown.Front Med (Lausanne). 2022 Nov 8;9:1021560. doi: 10.3389/fmed.2022.1021560. eCollection 2022. Front Med (Lausanne). 2022. PMID: 36425099 Free PMC article.
References
-
- Anderson, K.B., Thomas, S.J., Endy, T.P.: The emergence of zika virus. Ann. Intern. Med. 165(3), 175–183 (2016) - PubMed
-
- Anderson, R., May, R.: Infectious Diseases of Humans: Dynamics and Control. Dynamics and Control. OUP, Oxford (1992)
-
- Anderson, W.: Continuous-time Markov Chains: an Applications-Oriented Approach. Springer Series in Statistics. Springer, New York (2012)
-
- Arenas, A., Cota, W., Gómez-Gardeñes, J., Gómez, S., Granell, C., Matamalas, J.T., Soriano-Paños, D., Steinegger, B.: Modeling the spatiotemporal epidemic spreading of covid-19 and the impact of mobility and social distancing interventions. Phys. Rev. X 10, 041055 (2020). 10.1103/PhysRevX.10.041055
LinkOut - more resources
Full Text Sources