. 2024 Apr 16;10(1):39.
doi: 10.1186/s40798-024-00716-6.

The Night-Time Sleep and Autonomic Activity of Male and Female Professional Road Cyclists Competing in the Tour de France and Tour de France Femmes

Affiliations

The Night-Time Sleep and Autonomic Activity of Male and Female Professional Road Cyclists Competing in the Tour de France and Tour de France Femmes

Charli Sargent et al. Sports Med Open. .

Abstract

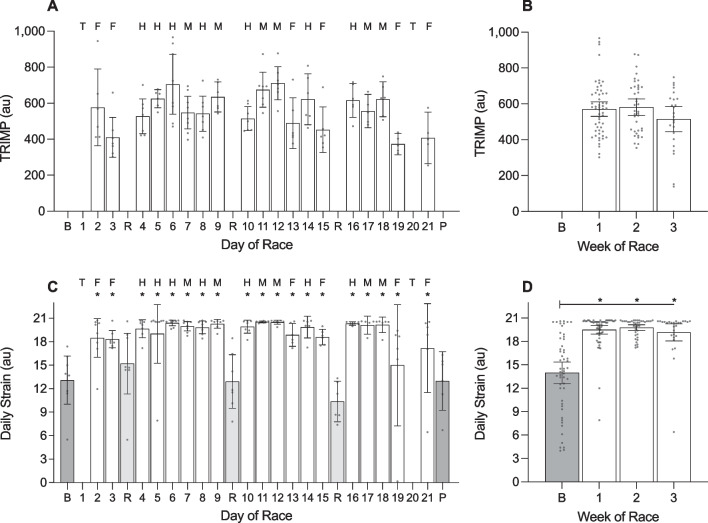
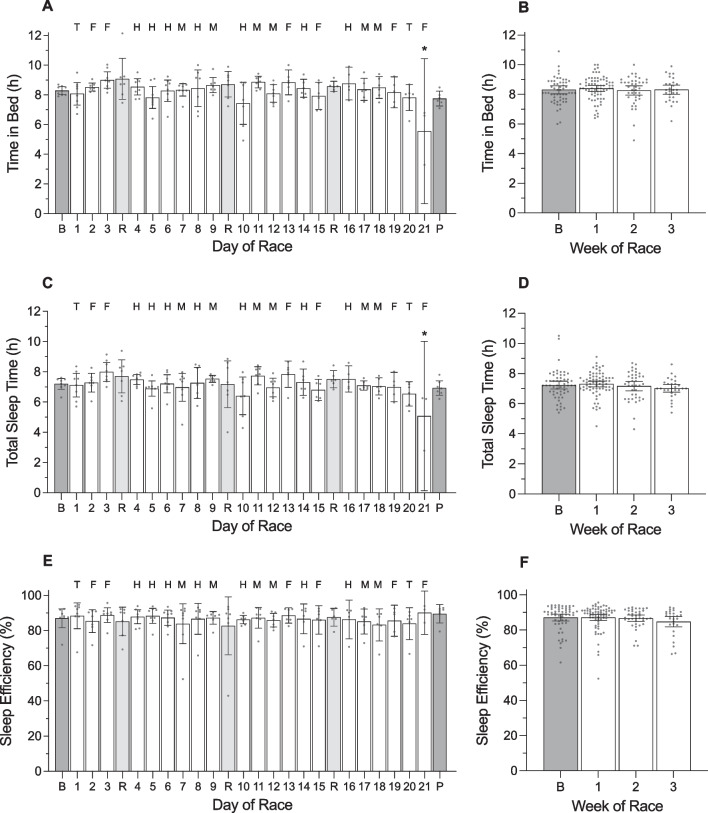
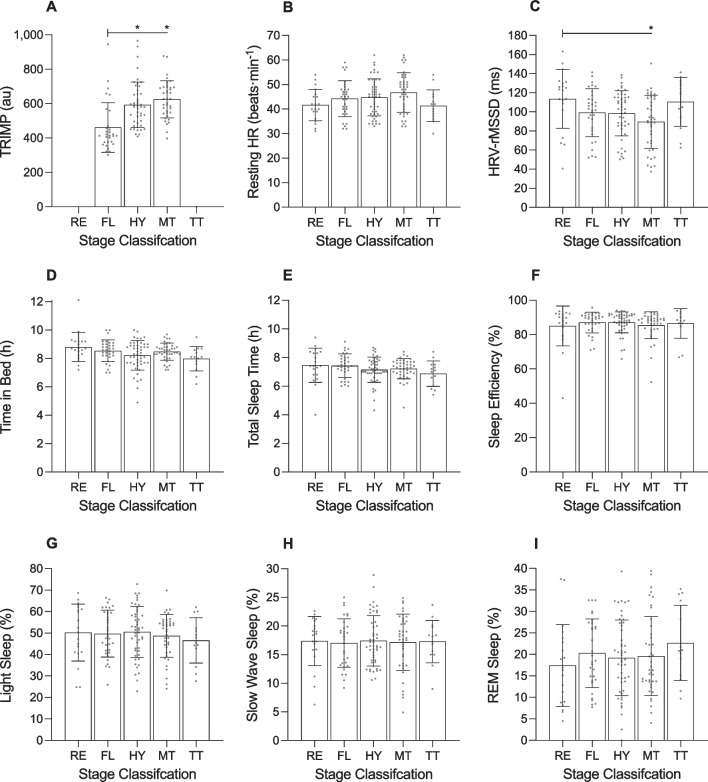
Background: Sleep is a critical component of recovery, but it can be disrupted following prolonged endurance exercise. The objective of this study was to examine the capacity of male and female professional cyclists to recover between daily race stages while competing in the 2022 Tour de France and the 2022 Tour de France Femmes, respectively. The 17 participating cyclists (8 males from a single team and 9 females from two teams) wore a fitness tracker (WHOOP 4.0) to capture recovery metrics related to night-time sleep and autonomic activity for the entirety of the events and for 7 days of baseline before the events. The primary analyses tested for a main effect of 'stage classification'-i.e., rest, flat, hilly, mountain or time trial for males and flat, hilly or mountain for females-on the various recovery metrics.

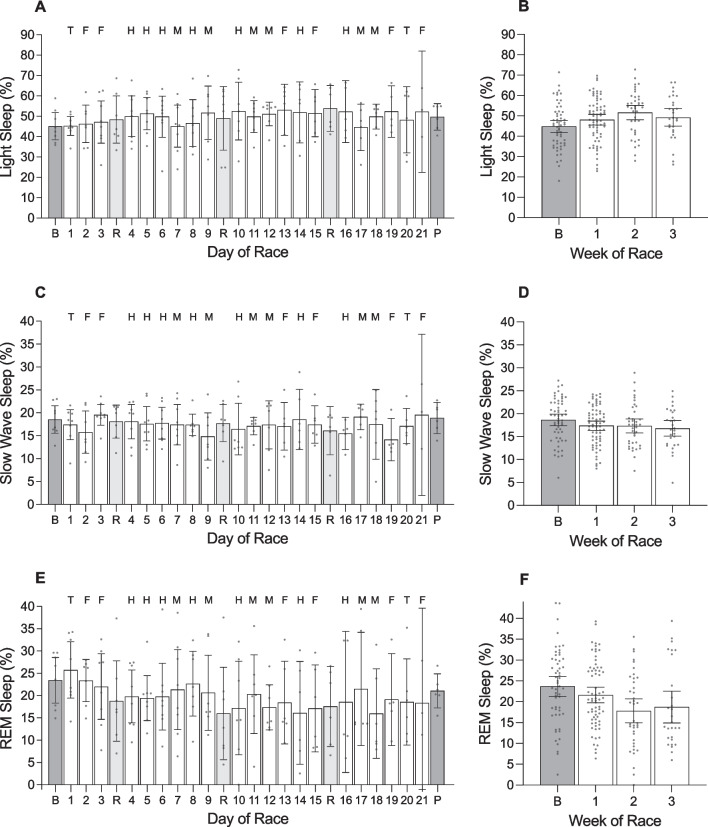
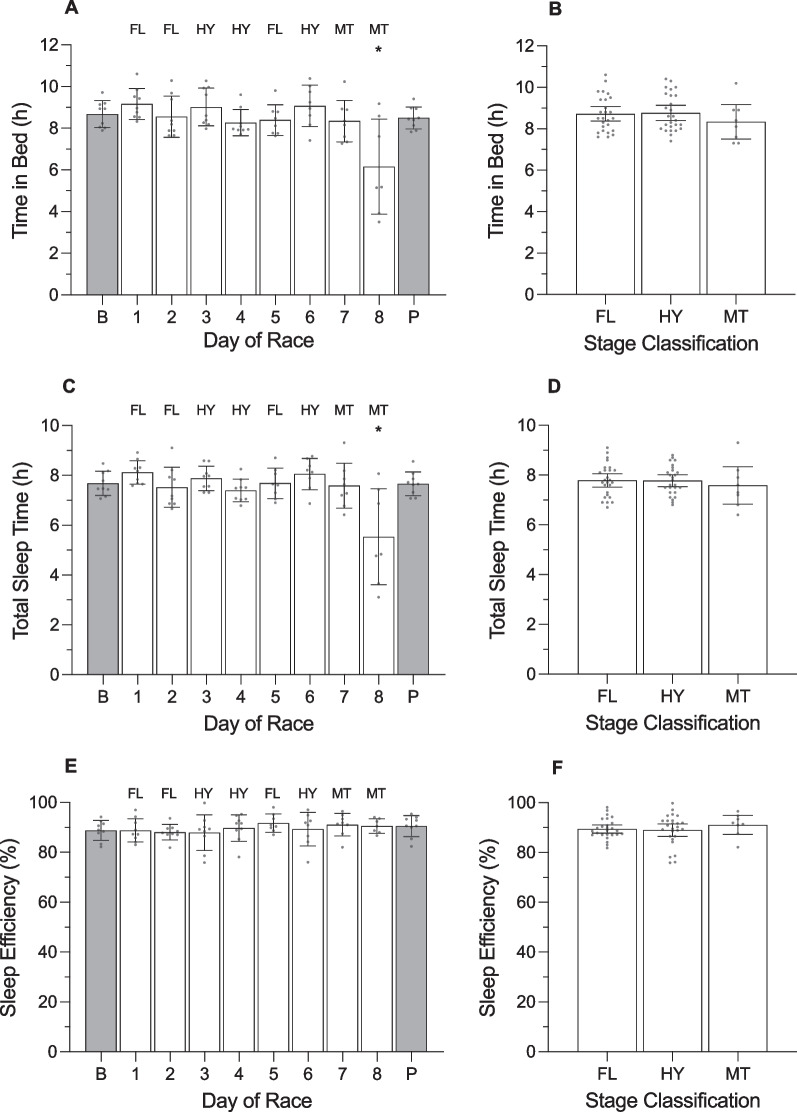
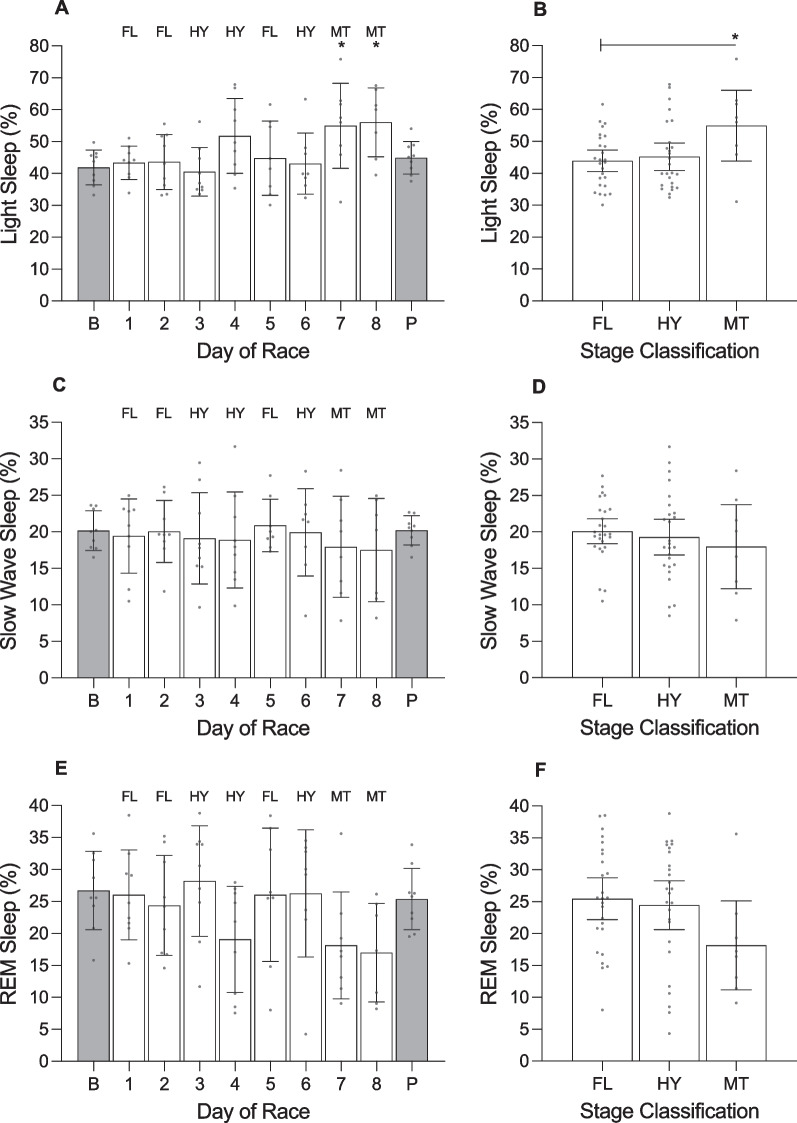
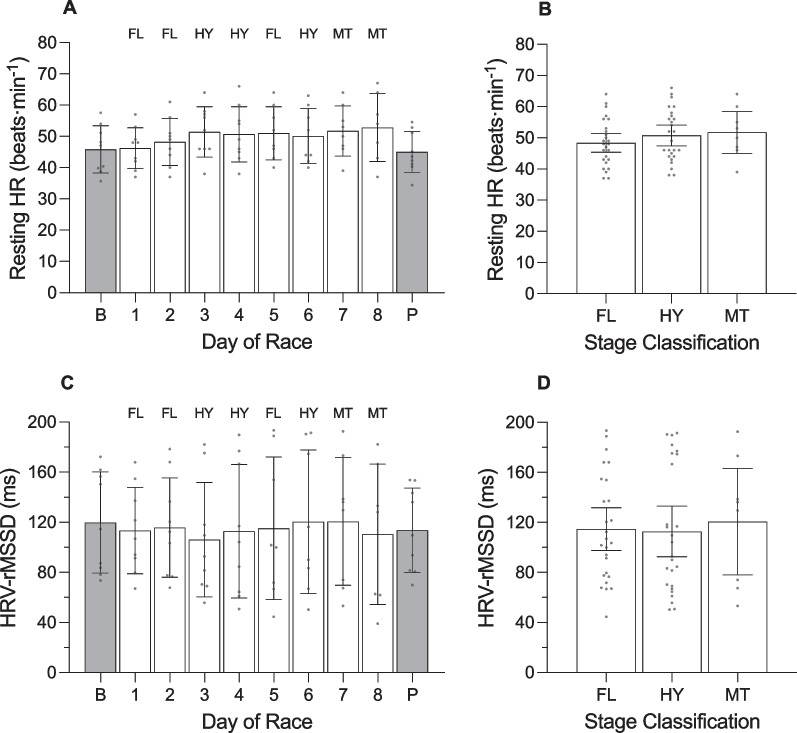
Results: During baseline, total sleep time was 7.2 ± 0.3 h for male cyclists (mean ± 95% confidence interval) and 7.7 ± 0.3 h for female cyclists, sleep efficiency was 87.0 ± 4.4% for males and 88.8 ± 2.6% for females, resting HR was 41.8 ± 4.5 beats·min-1 for males and 45.8 ± 4.9 beats·min-1 for females, and heart rate variability during sleep was 108.5 ± 17.0 ms for males and 119.8 ± 26.4 ms for females. During their respective events, total sleep time was 7.2 ± 0.1 h for males and 7.5 ± 0.3 h for females, sleep efficiency was 86.4 ± 1.2% for males and 89.6 ± 1.2% for females, resting HR was 44.5 ± 1.2 beats·min-1 for males and 50.2 ± 2.0 beats·min-1 for females, and heart rate variability during sleep was 99.1 ± 4.2 ms for males and 114.3 ± 11.2 ms for females. For male cyclists, there was a main effect of 'stage classification' on recovery, such that heart rate variability during sleep was lowest after mountain stages. For female cyclists, there was a main effect of 'stage classification' on recovery, such that the percentage of light sleep (i.e., lower-quality sleep) was highest after mountain stages.

Conclusions: Some aspects of recovery were compromised after the most demanding days of racing, i.e., mountain stages. Overall however, the cyclists obtained a reasonable amount of good-quality sleep while competing in these physiologically demanding endurance events. This study demonstrates that it is now feasible to assess recovery in professional athletes during multiple-day endurance events using validated fitness trackers.

Keywords: Athletes; Competition; Exercise; Heart rate variability; Recovery; Sleep duration; Wearables.


Conflict of interest statement

CS, DJM and GDR are members of a research group at CQUniversity that receives support for research (i.e., funding, equipment) from Whoop, Inc.; ERC is a shareholder and employee of Whoop, Inc; SJ and JP are employees of Whoop, Inc.

Figures

Fig. 1
Fig. 1
Timing of stages and sleep periods for male cyclists during the 2022 Tour de France. Each line represents a 24-h day from 10:00 AM to 10:00 AM. Black bars indicate the start/end times and duration of stages, based on the cyclists who participated in the study. The start/end times and duration of sleep periods for participating cyclists are represented by white bars for sleep after race stages, light grey bars for sleep after rest days and dark grey bars for sleep in the 14 days before and after competition. Data are mean and 95% confidence intervals. * indicates a significant difference from baseline (p < .05)
Fig. 2
Fig. 2
Training impulse (TRIMP) and daily strain of male cyclists during the Tour de France plotted as a function of day of race (panels a and c) and week of race (panels b and d). AU, arbitrary units. ‘B’ represents the baseline mean calculated at least one week prior to the first day of the race; ‘P’ indicates the post-race mean calculated from post-race night 2 to post-race night 9; ‘R’ indicates rest days; ‘T’ indicates individual time trial; ‘F’ indicates flat stages; ‘H’ indicates hilly stages; ‘M’ indicates mountain stages. Data are presented as mean (bars) and 95% confidence intervals (error bars). Closed circles represent individual cyclists. In the panel a for TRIMP, the results of the post-hoc analysis are not shown. In panels c and d for daily strain, * indicates a significant difference from baseline (p < .05)
Fig. 3
Fig. 3
Time in bed, total sleep time, and sleep efficiency of male cyclists during the Tour de France plotted as a function of day of race (panels a, c, e) and week of race (panels b, d, f). ‘B’ represents the baseline mean calculated at least one week prior to the first day of the race; ‘P’ indicates the post-race mean calculated from post-race night 2 to post-race night 9; ‘R’ indicates rest days; ‘T’ indicates individual time trial; ‘F’ indicates flat stages; ‘H’ indicates hilly stages; ‘M’ indicates mountain stages. Data are presented as mean (bars) and 95% confidence intervals (error bars). Closed circles represent individual cyclists. In panels a and c, * indicates a significant difference from baseline (p < .05)
Fig. 4
Fig. 4
The percentage of light sleep, slow wave sleep and rapid eye movement (REM) sleep obtained by male cyclists during the Tour de France plotted as a function of day of race (panels a, c, e) and week of race (panels b, d, f). ‘B’ represents the baseline mean calculated at least one week prior to the first day of the race; ‘P’ indicates the post-race mean calculated from post-race night 2 to post-race night 9; ‘R’ indicates rest days; ‘T’ indicates individual time trial; ‘F’ indicates flat stages; ‘H’ indicates hilly stages; ‘M’ indicates mountain stages. Data are presented as mean (bars) and 95% confidence intervals (error bars). Closed circles represent individual cyclists
Fig. 5
Fig. 5
Resting heart rate (HR) and heart rate variability (HRV) of male cyclists during the Tour de France plotted as a function of day of race (panels a and c) and week of race (panels b and d). HRV was calculated using the root-mean-square of successive differences between heartbeats (rMSSD and is reported in milliseconds (ms). ‘B’ represents the baseline mean calculated at least one week prior to the first day of the race; ‘P’ indicates the post-race mean calculated from post-race night 2 to post-night 9; ‘R’ indicates rest days; ‘T’ indicates individual time trial; ‘F’ indicates flat stages; ‘H’ indicates hilly stages; ‘M’ indicates mountain stages. Data are presented as mean (bars) and 95% confidence intervals (error bars). Closed circles represent individual cyclists. In the left and right panels, * indicates a significant difference from baseline (p < .05)
Fig. 6
Fig. 6
Training impulse (TRIMP; panel a), resting heart rate (HR; panel b), heart rate variability (HRV; panel c) and sleep (panels di) of male cyclists during the Tour de France plotted as a function of stage classification. AU, arbitrary units. HRV was calculated using the root-mean-square of successive differences between heartbeats (rMSSD and is reported in milliseconds (ms). ‘RE’ indicates transfer/rest days; ‘FL’ indicates flat stages; ‘HY’ indicates hilly stages; ‘MT’ indicates mountain stages; and ‘TT’ indicates time trials. Data are presented as mean (bars) and 95% confidence intervals (error bars). Closed circles represent individual cyclists. * in panels a and c indicates a significant difference between stage classifications (p < .05)
Fig. 7
Fig. 7
Timing of stages and sleep periods for female cyclists during the 2022 Tour de France Femmes. Each line represents a 24-h day from 10:00 AM to 10:00 AM. Black bars indicate the start/end times and duration of stages, based on the cyclists who participated in the study. The start/end times and duration of sleep periods for participating cyclists are represented by white bars for sleep after race stages and dark grey bars for sleep in the 14 days before and after competition. Data are mean and 95% confidence intervals. * indicates a significant difference from baseline (p < .05)
Fig. 8
Fig. 8
Training impulse (TRIMP) and daily strain of female cyclists during the Tour de France Femmes plotted as a function of day of race (panels a and c) and stage classification (panels b and d). AU, arbitrary units. ‘B’ represents the baseline mean calculated at least one week prior to the first day of the race; ‘P’ indicates the post-race mean calculated from post-race night 2 to post-race night 9; ‘FL’ indicates flat stages; ‘HY’ indicates hilly stages; ‘MT’ indicates mountain stages. Data are presented as mean (bars) and 95% confidence intervals (error bars). Closed circles represent individual cyclists. In panel d, * indicates a significant difference from baseline (p < .05)
Fig. 9
Fig. 9
Time in bed, total sleep time, and sleep efficiency of female cyclists during the Tour de France Femmes plotted as a function of day of race (panels a, c, e) and stage classification (panels b, d, f). ‘B’ represents the baseline mean calculated at least one week prior to the first day of the race; ‘P’ indicates the post-race mean calculated from post-race night 2 to post-race night 9; ‘FL’ indicates flat stages; ‘HY’ indicates hilly stages; ‘MT’ indicates mountain stages. Data are presented as mean (bars) and 95% confidence intervals (error bars). Closed circles represent individual cyclists. In panels a and d, * indicates a significant difference from baseline (p < .05)
Fig. 10
Fig. 10
The percentage of light sleep, slow wave sleep and rapid eye movement (REM) sleep obtained by female cyclists during the Tour de France Femmes plotted as a function of day of race (panels a, c, e) and stage classification (panels b, d, f). ‘B’ represents the baseline mean calculated at least one week prior to the first day of the race; ‘P’ indicates the post-race mean calculated from post-race night 2 to post-race night 9; ‘FL’ indicates flat stages; ‘HY’ indicates hilly stages; ‘MT’ indicates mountain stages. Data are presented as mean (bars) and 95% confidence intervals (error bars). Closed circles represent individual cyclists. In panel a, * indicates a significant difference from baseline (p < .05). In panel b * indicates a significant difference between stage classifications (p < .05)
Fig. 11
Fig. 11
Resting heart rate (HR) and heart rate variability (HRV) of female cyclists during the Tour de France Femmes plotted as a function of day of race (panels a and c) and stage classification (panels b and d). HRV was calculated using the root-mean-square of successive differences between heartbeats (rMSSD and is reported in milliseconds (ms). ‘B’ represents the baseline mean calculated at least one week prior to the first day of the race; ‘P’ indicates the post-race mean calculated from post-race night 2 to post-race night 9; ‘FL’ indicates flat stages; ‘HY’ indicates hilly stages; ‘MT’ indicates mountain stages. Data are presented as mean (bars) and 95% confidence intervals (error bars). Closed circles represent individual cyclists

References

    1. Santalla A, Earnest CP, Marroyo JA, Lucía A. The Tour de France: an updated physiological review. Int J Sports Physiol Perform. 2012;7:200–209. doi: 10.1123/ijspp.7.3.200. - DOI - PubMed
    1. Lucía A, Hoyos J, Santalla A, Earnest C, Chicharro JL. Tour de France versus Vuelta a España: Which is harder? Med Sci Sports Exerc. 2003;35:872–878. doi: 10.1249/01.MSS.0000064999.82036.B4. - DOI - PubMed
    1. Fernández-García B, Pérez-Landaluce J, Rodríguez-Alonso M, Terrados N. Intensity of exercise during road race pro-cycling competition. Med Sci Sports Exerc. 2000;32:1002–1006. doi: 10.1097/00005768-200005000-00019. - DOI - PubMed
    1. Sanders D, van Erp T. The physical demands and power profile of professional men’s cycling races: an updated review. Int J Sports Physiol Perform. 2021;16:3–12. doi: 10.1123/ijspp.2020-0508. - DOI - PubMed
    1. Muriel X, Valenzuela PD, Mateo-March M, Pallarés JG, Lucía A, Barranco-Gil D. Physical demands and performance indicators in male professional cyclists during a Grand Tour: WorldTour versus ProTeam category. Int J Sports Physiol Perform. 2022;17:22–30. doi: 10.1123/ijspp.2021-0082. - DOI - PubMed

LinkOut - more resources