. 2024 Apr 23;43(4):114120.
doi: 10.1016/j.celrep.2024.114120. Epub 2024 Apr 15.

CCR2+ monocytes replenish border-associated macrophages in the diseased mouse brain

Affiliations

CCR2+ monocytes replenish border-associated macrophages in the diseased mouse brain

Lingxiao Wang et al. Cell Rep. .

Abstract

Border-associated macrophages (BAMs) are tissue-resident macrophages that reside at the border of the central nervous system (CNS). Since BAMs originate from yolk sac progenitors that do not persist after birth, the means by which this population of cells is maintained is not well understood. Using two-photon microscopy and multiple lineage-tracing strategies, we determine that CCR2+ monocytes are significant contributors to BAM populations following disruptions of CNS homeostasis in adult mice. After BAM depletion, while the residual BAMs possess partial self-repopulation capability, the CCR2+ monocytes are a critical source of the repopulated BAMs. In addition, we demonstrate the existence of CCR2+ monocyte-derived long-lived BAMs in a brain compression model and in a sepsis model after the initial disruption of homeostasis. Our study reveals that the short-lived CCR2+ monocytes transform into long-lived BAM-like cells at the CNS border and subsequently contribute to BAM populations.

Keywords: BAM; CCR2; CP: Immunology; CP: Neuroscience; LPS; border-associated macrophages; brain compression; csf1; meningitis; microglia; monocyte; repopulation.


Conflict of interest statement

Declaration of interests The authors declare no competing interests.

Figures
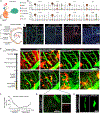
Figure 1.
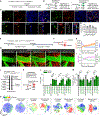
Figure 1.. BAMs can partially self-repopulate after depletion.
(A) UMAP plot of immune cell populations collected from the brain and its border in dataset GEO: GSE128855. (B) Violin plot of the selected top 8 marker genes for BAMs. (C) Illustration of the brain border compartments and associated BAMs. (D) Immunostaining of CD206+ BAMs from different CNS border compartments. Scale bar, 100 mm and 40 μm (inset). (E) Two-photon chronic imaging of tdTomato+ BAMs in the meninges and dextran-FITC labeled blood vessels throughout the depletion and repopulation period. White arrowheads show the tdTomato FITC+ cells resembling BAMs during repopulation, indicating different origins of the repopulated BAMs. Scale bar, 100 μm. (F) Quantification of tdTomato+ BAM numbers per 300 × 300 mm2 field of view throughout the depletion and repopulation (n = 3 mice). Data are presented as mean ± SEM. (G) Magnified image from (E), showing the tdTomato FITC+ cells observed at repopulation day 7 (rectangle in E). Scale bar, 20 μm. (H) Representative tdTomato FITC+ cells resembling dmBAMs and mBAMs at repopulation day 14 (white arrowhead in E). Scale bar, 10 μm.
Figure 2.
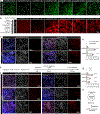
Figure 2.. CCR2+ monocytes can replenish the depleted BAMs.
(A, B, E, F, J, and K) Illustration of the experiment design, timeline, and hypothesis. (C) Immunostaining of whole-mount dura mater and choroid plexus and coronal brain slides with leptomeninges attached from CCR2CreER/+::Rosa26DTR/+ mice at repopulation week 3. Scale bars, 50 μm and 10 μm as indicated. (D) Quantification of DTR+CD206+ BAMs in different border compartments after repopulation. Data are presented as mean ± SEM (n = 3 mice). (G–I) Two-photon chronic imaging of the infiltration and transformation of CCR2+ monocytes into BAM-like cells during repopulation. Arrowheads indicate dmBAM-like and mBAMs-like cells at repopulation day 28. Quantification of CCR2+ cell shapes at repopulation days 0, 2, 7, 14, and 28 are presented as mean ±95% confidence interval (n = 3 mice). (L) Percentage of tdTomato+ cells in microglia and BAM subtypes in control and at different repopulation time points. Data are presented as mean ± SEM (n = 3 mice). *p < 0.05, **p < 0.01, ***p < 0.001, one-way ANOVA with Tukey’s multiple-comparisons test. (M) Percentage of MHC class IIhi cells in tdTomato+ BAM subtypes in control and at different repopulation time points. Data are presented as mean ± SEM (n = 3 mice). *p < 0.05, **p < 0.01, one-way ANOVA with Tukey’s multiple-comparisons test. (N) tSNE heatmap of tdTomato expression in microglia and BAM subtypes from both control and repopulated conditions. Dashed circles indicate the tdTomato+ repopulated BAMs.
Figure 3.
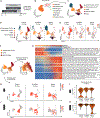
Figure 3.. scRNA-seq reveals the close relationship of CCR2+ monocytes with the BAMs.
(A) Illustration of the experiment design and group information. (B) UMAP plot of all cells collected in the dataset GEO: GSE150169. (C) UMAP plot of the BAMs/monocytes/monocytes-derived cells/DCs from (B). (D) UMAP plot of the BAMs/monocytes/monocytes-derived cells/DCs split by time points, showing the loss of BAMs induced by PLX5622. (E) Heatmap of the Csf1r gene expression split by time points. Dashed lines indicate the loss of cells with high Csf1r expression. (F) UMAP of classical monocytes (cMonocytes), classical monocyte-derived cells (cMdCs), and the MHC class IIlo BAM subset from (C). These three populations were further analyzed by SCORPIUS trajectory inference, where they were linearly aligned along SCORPIUS component 1. (G) The top 250 genes corresponding to the transition from monocytes to BAMs that were clustered by different gene expression trends, showing a gradientdecrease of monocyte markers and increase of BAM markers. (H and J) Heatmaps of cMonocytes, cMdC, MHC class IIlo BAMs from (F), split by time points, showing the expression of the Ccr2 and H2-Ab1 genes. Dashed circles indicate the cMdC population. (I and K) Violin plots of cMonocytes, cMdCs, and MHC class IIlo BAMs corresponding to (H) and (J), showing the distribution of Ccr2 and H2-Ab1 expression in cMdCs at different time points. Arrows indicate the increased portion of the CCR2hiMHC class IIlo/neg cells in the cMdC cluster at repopulation day 2.
Figure 4.
Figure 4.. Long-term engraftment and transformation of CCR2+ monocytes into BAMs in the diseased brain.
(A) Two-photon chronic imaging showing the acute loss of dmBAMs and mBAMs after mild cortical compression and the chronic replenishment of these cells inthe Cx3cr1Gfp/+ mice. Arrowheads indicate dmBAMs and mBAMs. Scale bar, 20 μm. (B) Two-photon chronic imaging showing the infiltration and transformation of CCR2+ monocytes into dmBAM-like and mBAM-like cells in the meninges 12 weeks after mild cortical compression in Ccr2CreER/+::R26tdTomato/+ mice. Scale bars, 20 μm. (C and D) Immunostaining of the dura mater and leptomeninges and quantifications of tdTomato+CD206+ BAMs in the compression and non-compression regions at 12 weeks post injury. Data are presented as mean ± SEM (n = 3 mice). **p < 0.01, paired t test. (E) Illustration of the study plan and timeline. (F and G) Immunostaining and quantifications of tdTomato+CD206+ BAMs in the dura mater and leptomeninges at 8 weeks post LPS or PBS injection. Data are presented as mean ± SEM (n = 3 mice). **p < 0.01, ***p < 0.001, unpaired t test. Scale bars, 100 μm. (H) Illustration of our conclusion that CCR2+ monocytes could replenish the lost BAMs in addition to BAM self-proliferation.

References

    1. Herz J, Filiano AJ, Wiltbank AT, Yogev N, and Kipnis J (2017). Myeloid Cells in the Central Nervous System. Immunity 46, 943–956. 10.1016/j.immuni.2017.06.007. - DOI - PMC - PubMed
    1. Kierdorf K, Masuda T, Jordão MJC, and Prinz M (2019). Macrophages at CNS interfaces: ontogeny and function in health and disease. Nat. Rev. Neurosci. 20, 547–562. 10.1038/s41583-019-0201-x. - DOI - PubMed
    1. Masuda T, Amann L, Monaco G, Sankowski R, Staszewski O, Krueger M, Del Gaudio F, He L, Paterson N, Nent E, et al. (2022). Specification of CNS macrophage subsets occurs postnatally in defined niches. Nature 604, 740–748. 10.1038/s41586-022-04596-2. - DOI - PubMed
    1. Prinz M, Jung S, and Priller J (2019). Microglia Biology: One Century of Evolving Concepts. Cell 179, 292–311. 10.1016/j.cell.2019.08.053. - DOI - PubMed
    1. Davies LC, Jenkins SJ, Allen JE, and Taylor PR (2013). Tissue-resident macrophages. Nat. Immunol. 14, 986–995. 10.1038/ni.2705. - DOI - PMC - PubMed

Publication types