. 2024 Apr 16;22(4):e3002577.
doi: 10.1371/journal.pbio.3002577. eCollection 2024 Apr.

How do bacterial endosymbionts work with so few genes?

Affiliations

How do bacterial endosymbionts work with so few genes?

John P McCutcheon et al. PLoS Biol. .

Abstract

The move from a free-living environment to a long-term residence inside a host eukaryotic cell has profound effects on bacterial function. While endosymbioses are found in many eukaryotes, from protists to plants to animals, the bacteria that form these host-beneficial relationships are even more diverse. Endosymbiont genomes can become radically smaller than their free-living relatives, and their few remaining genes show extreme compositional biases. The details of how these reduced and divergent gene sets work, and how they interact with their host cell, remain mysterious. This Unsolved Mystery reviews how genome reduction alters endosymbiont biology and highlights a "tipping point" where the loss of the ability to build a cell envelope coincides with a marked erosion of translation-related genes.


Conflict of interest statement

The authors have declared that no competing interests exist.

Figures

Fig 1
Fig 1. Small genome endosymbionts are derived from diverse bacteria.
A phylogenetic tree of bacteria, where major groups containing organisms with genomes of less than 1 Mb are noted in blue, and groups with organisms containing genomes less than 200 kb are shown in red. The curved lines represent the approximate position of these groups on the tree. The yellow outline on the tree is there to de-emphasize the precision of the branches and to remind the reader that the group locations are approximate. The tree structure and phyla location were adapted from [1].
Fig 2
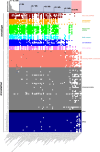
Fig 2. Loss and retention of cell envelope and translation-related genes in bacteria with reduced genomes.
The sizes of representative genomes of less than 1 Mb, with a few larger genomes included, are arrayed across the top as grey bars in decreasing genome size from left to right. Bars boxed in blue are less than 1 Mb but greater than 200 kb, those boxed in red are the tipping-point endosymbionts with genomes less than 200 kb. Envelope-related genes are separated by categories where a colored box indicates the gene is present and a white box indicates a gene is absent. Translation-related genes are similarly arrayed on the bottom part of the figure. In general, the complete loss of the ability to autonomously make a cell envelope (fatty acids, phospholipids, cell wall) occurs in bacteria with genomes smaller than about 400 kb, and these losses coincide with losses in the ability to transport macromolecules across (BAM complex, sec translocon) or insert into (ATP synthase) lipid bilayers. Genomes less than 200 kb start to lose a significant number of ribosomal proteins, tRNAs, and amino acyl-tRNA synthetases. Organisms for this figure were chosen by manually selecting species from the GenBank prokaryotes list. All organisms with genomes less than 1 Mb were included except in cases where multiple examples from the same genus were present, where the largest and smallest genome from the genus were selected. Genomic data for these organisms was downloaded from GenBank using the bit software toolkit [11]. Gene presence and absence were calculated from a combination of literature review, existing GenBank annotations, and by performing searches against HMMER [12] profiles in the Pfam and TIGRFAM databases. We caution that some genomes included are in draft form, and so the exact gene patterns should be considered tentative. The code and raw data used to generate this figure are available at https://zenodo.org/records/10780716.
Fig 3
Fig 3. Endosymbionts proteins have extreme compositional biases.
A principal component analysis (PCA) of amino acid frequencies from 98,966 bacterial and archaeal genomes. Each dot represents an amino acid profile from a single genome. Both A and B show the same data, where PC1 contains 85% of the variance and PC2 5%. (A) The GC content of the genome is shaded from blue (high GC content) to orange (low GC content), showing that the variation in amino acid frequencies are mostly driven by the GC content of the genome. (B) Representative extremophiles are colored black, organisms with genomes of less than 1 Mb in length are colored blue, organisms with genomes of less than 200 kb are colored red, and all other organisms are colored grey. Endosymbionts tend to be on the right side of this plot, reflecting their low genome GC content, and many endosymbionts—especially tipping-point endosymbionts—are well off the main cloud of prokaryotic proteome variance, likely reflecting their rapid rates of sequence evolution. Zinderia is colored blue because it just missed our somewhat arbitrary cutoff of 200 kb. PCA was done using factoextra. Amino acid frequencies and GC content were calculated on proteomes from the RefSeq database using custom Python scripts, which, along with data files used in this analysis, are available here: https://zenodo.org/records/10780716.
Fig 4
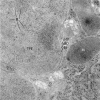
Fig 4. Cellular structure of an endosymbiont with a tiny genome.
A transmission electron micrograph of a tipping-point endosymbiont (TPE) inside an insect cell. Image is of the endosymbiont Tremblaya princeps from the mealybug Planococcus citri and is courtesy of Dalton Leprich of Arizona State University. BI, bacterial inner membrane; BO, bacterial outer membrane; HV, host vacuolar membrane; M, insect mitochondrion; R, a few TPE ribosomes; RER, rough ER in the insect cytoplasm; TPE, the cytoplasm of the endosymbiont.

Comment in

References

    1. Mendler K, Chen H, Parks DH, Lobb B, Hug LA, Doxey AC. AnnoTree: visualization and exploration of a functionally annotated microbial tree of life. Nucleic Acids Res. 2019;47:4442–4448. doi: 10.1093/nar/gkz246 - DOI - PMC - PubMed
    1. Parks DH, Chuvochina M, Waite DW, Rinke C, Skarshewski A, Chaumeil P-A, et al.. A standardized bacterial taxonomy based on genome phylogeny substantially revises the tree of life. Nat Biotechnol. 2018;36:996–1004. doi: 10.1038/nbt.4229 - DOI - PubMed
    1. Ochman H, Groisman EA. The origin and evolution of species differences in Escherichia coli and Salmonella typhimurium. EXS. 1994;69:479–493. doi: 10.1007/978-3-0348-7527-1_27 - DOI - PubMed
    1. Yonezawa T, Segawa T, Mori H, Campos PF, Hongoh Y, Endo H, et al.. Phylogenomics and Morphology of Extinct Paleognaths Reveal the Origin and Evolution of the Ratites. Curr Biol. 2017;27:68–77. doi: 10.1016/j.cub.2016.10.029 - DOI - PubMed
    1. Battistuzzi FU, Feijao A, Hedges SB. A genomic timescale of prokaryote evolution: insights into the origin of methanogenesis, phototrophy, and the colonization of land. BMC Evol Biol. 2004;4:44. doi: 10.1186/1471-2148-4-44 - DOI - PMC - PubMed