. 2024 Apr 16;20(4):e1011635.
doi: 10.1371/journal.ppat.1011635. eCollection 2024 Apr.

Evidence for vagal sensory neural involvement in influenza pathogenesis and disease

Affiliations

Evidence for vagal sensory neural involvement in influenza pathogenesis and disease

Nathalie A J Verzele et al. PLoS Pathog. .

Abstract

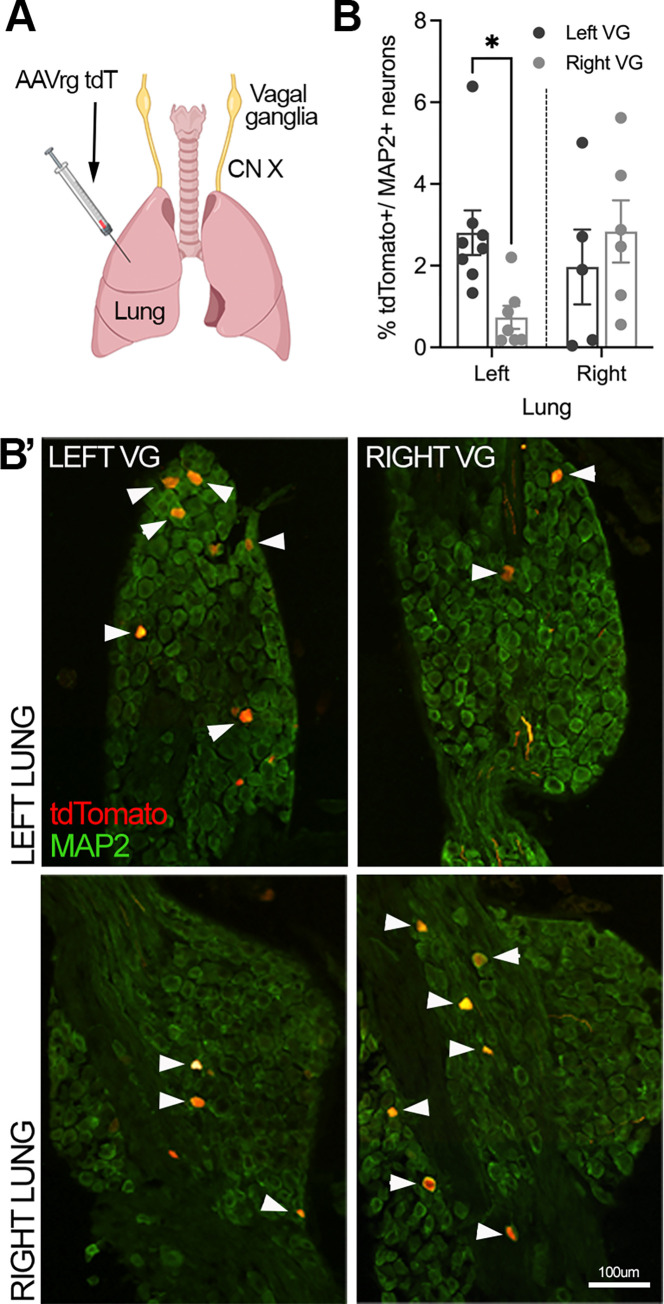
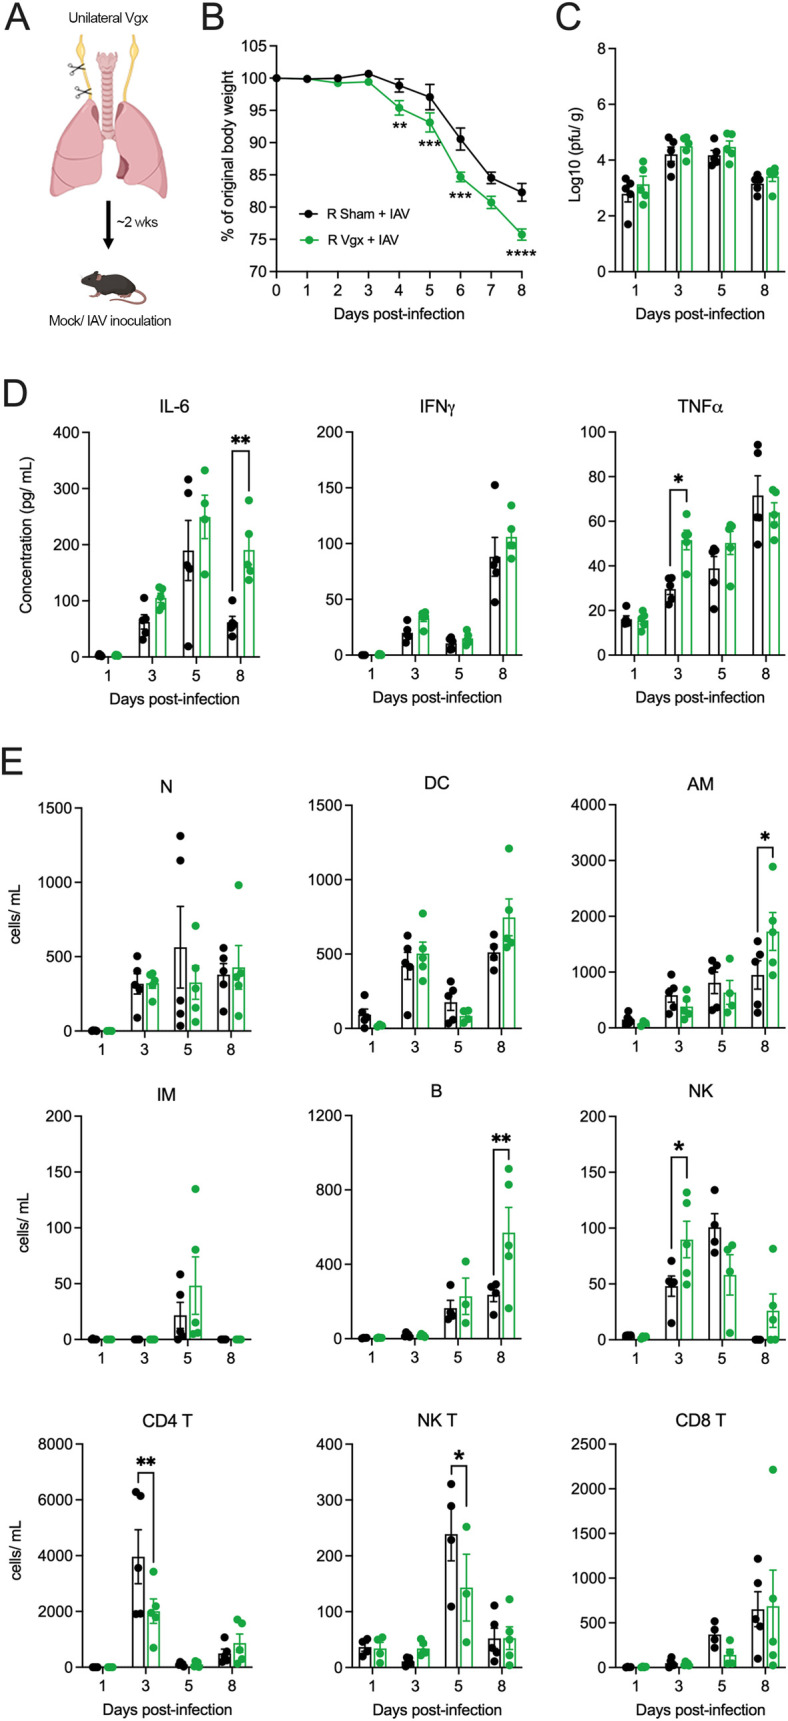
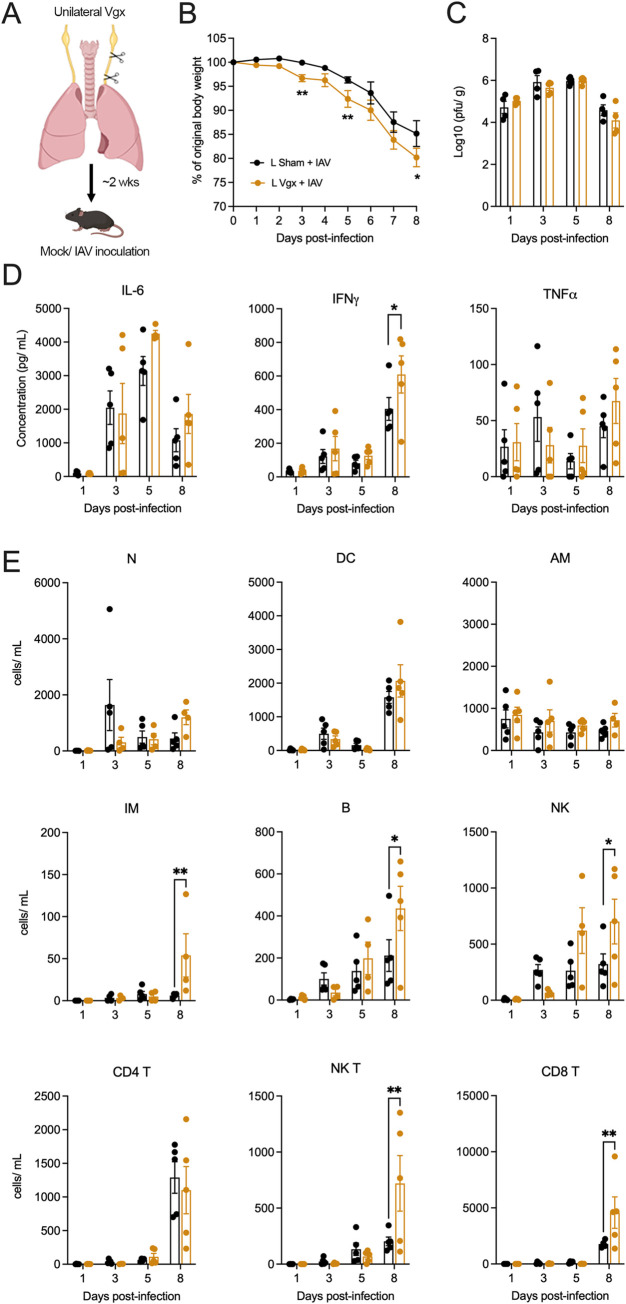
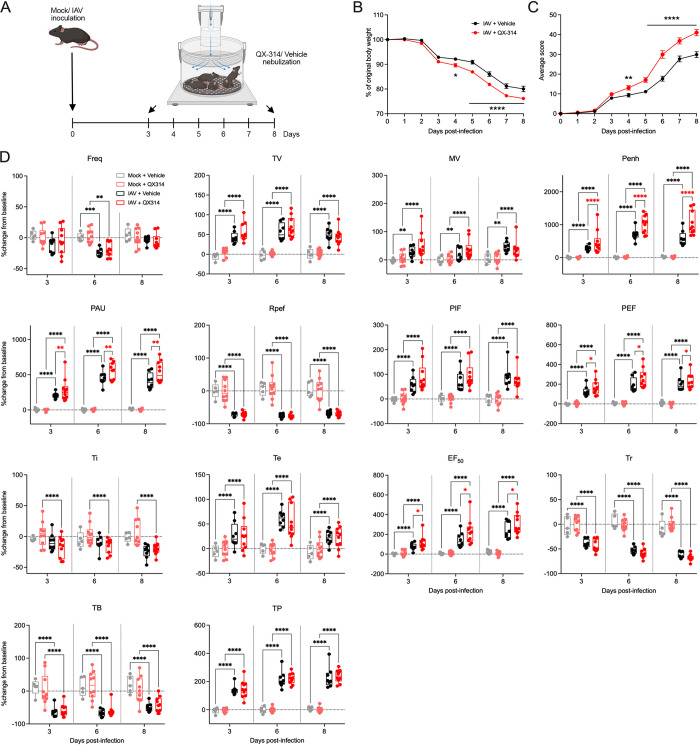
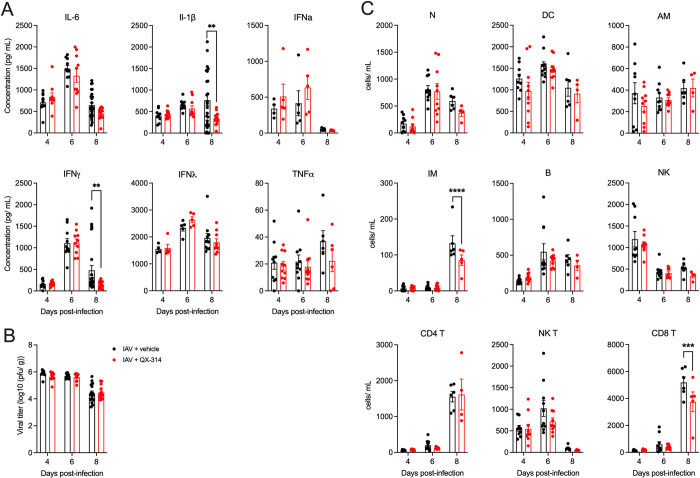
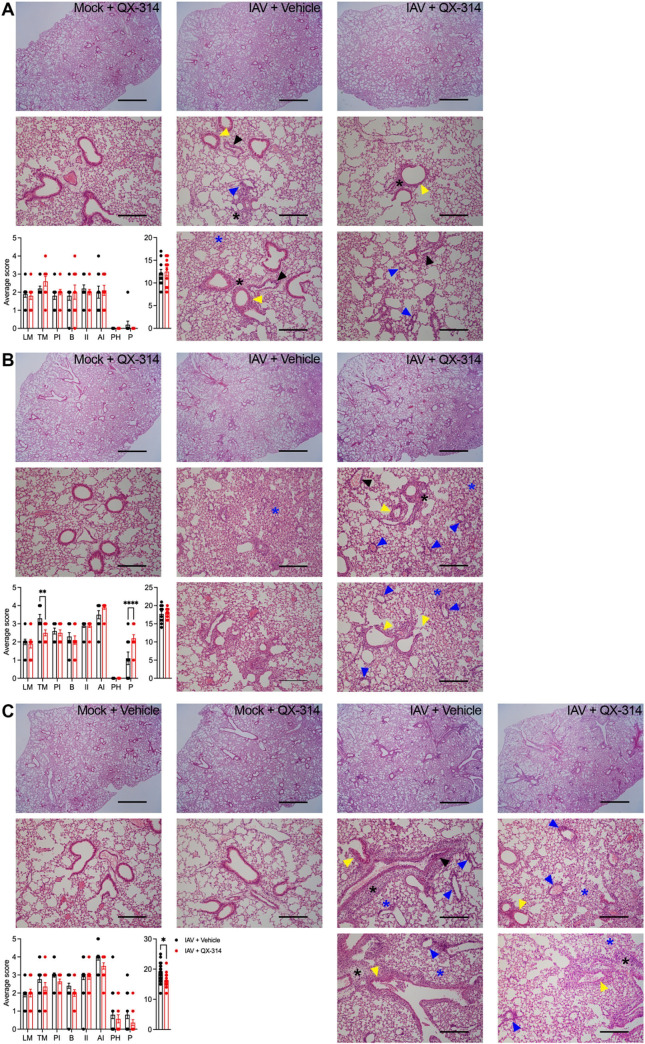
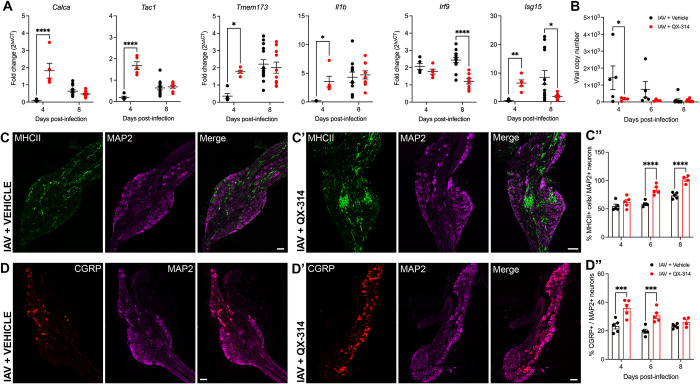
Influenza A virus (IAV) is a common respiratory pathogen and a global cause of significant and often severe morbidity. Although inflammatory immune responses to IAV infections are well described, little is known about how neuroimmune processes contribute to IAV pathogenesis. In the present study, we employed surgical, genetic, and pharmacological approaches to manipulate pulmonary vagal sensory neuron innervation and activity in the lungs to explore potential crosstalk between pulmonary sensory neurons and immune processes. Intranasal inoculation of mice with H1N1 strains of IAV resulted in stereotypical antiviral lung inflammation and tissue pathology, changes in breathing, loss of body weight and other clinical signs of severe IAV disease. Unilateral cervical vagotomy and genetic ablation of pulmonary vagal sensory neurons had a moderate effect on the pulmonary inflammation induced by IAV infection, but significantly worsened clinical disease presentation. Inhibition of pulmonary vagal sensory neuron activity via inhalation of the charged sodium channel blocker, QX-314, resulted in a moderate decrease in lung pathology, but again this was accompanied by a paradoxical worsening of clinical signs. Notably, vagal sensory ganglia neuroinflammation was induced by IAV infection and this was significantly potentiated by QX-314 administration. This vagal ganglia hyperinflammation was characterized by alterations in IAV-induced host defense gene expression, increased neuropeptide gene and protein expression, and an increase in the number of inflammatory cells present within the ganglia. These data suggest that pulmonary vagal sensory neurons play a role in the regulation of the inflammatory process during IAV infection and suggest that vagal neuroinflammation may be an important contributor to IAV pathogenesis and clinical presentation. Targeting these pathways could offer therapeutic opportunities to treat IAV-induced morbidity and mortality.


Conflict of interest statement

The authors have declared that no competing interests exist.

Figures

Fig 1
Fig 1. Characterization of the left and right vagal sensory ganglia innervation to the lungs.
(A) Schematic showing retrograde viral tracing with AAVrgtdT to quantify the ratio of right and left lung projecting sensory neurons in the ipsilateral versus contralateral vagal sensory ganglia. (B) Quantification of the percentage of tdTomato+ neurons per MAP2+ neurons in either left or right vagal sensory ganglia innervating the left (n = 8) or right lung (n = 6) with (B’) representative images depicting examples of traced neurons in the vagal sensory ganglia. Data represented as mean ± SEM. * denotes significance of p < 0.05, as determined by two-way ANOVA corrected for multiple comparisons (Šídák). CN X, vagus nerve; VG, vagal ganglia. Scale bar represents 100 μm. Cartoons were created with BioRender.com.
Fig 2
Fig 2. The impact of right vagotomy on IAV induced pathogenesis.
(A) Schematic outlining the procedure for surgically removing partial vagal innervation to the lungs (right unilateral vagotomy). Graphs depict group level (B) body weight change, (C) lung viral titers, (D) lung cytokine measurements and (E) lung immune cell populations over the course of IAV infection following either right vagotomy (Vgx) or sham surgery (n = 5 per group at days 1, 3, 5, 8 post IAV infection). Data represented as mean ± SEM. *, **, ***, **** denotes significance of p < 0.05, p < 0.01, p < 0.001, p < 0.0001, respectively, as determined by repeated measures two-way ANOVA corrected for multiple comparisons (Šídák). N, neutrophils; DC, dendritic cells; AM, alveolar macrophages; IM, interstitial macrophages; B, B cells; NK, natural killer cells. Cartoons were created with BioRender.com.
Fig 3
Fig 3. The impact of left vagotomy on IAV induced pathogenesis.
(A) Schematic outlining the procedure for surgically removing partial vagal innervation to the lungs (left unilateral vagotomy). Graphs depict group level (B) body weight change, (C) lung viral titers, (D) lung cytokine measurements and (E) lung immune cell populations over the course of IAV infection following either right vagotomy (Vgx) or sham surgery (n = 5 per group at days 1, 3, 5, 8 post IAV infection). Data represented as mean ± SEM. *, ** denotes significance of p < 0.05, p < 0.01, respectively, as determined by repeated measures two-way ANOVA corrected for multiple comparisons (Šídák). N, neutrophils; DC, dendritic cells; AM, alveolar macrophages; IM, interstitial macrophages; B, B cells; NK, natural killer cells. Cartoons were created with BioRender.com.
Fig 4
Fig 4. The impact of genetic ablation of pulmonary vagal sensory neurons on IAV pathogenesis.
(A) Schematic showing genetic ablation of nodose lung sensory neurons in the vagal sensory ganglia using retrograde AAV encoding Cre-inducible diphtheria toxin (AAVrg mCherry-FLEX-DTA) in Phox2B-Cre+ (n = 6) and Phox2B-Cre- (n = 5) mice. (B) Quantification of the total number of mCherry+ neurons in the vagal sensory ganglia with (B’ and B”) showing representative images of the vagal sensory ganglia and brainstem nucleus of the solitary tract (NTS) taken from Phox2B-Cre+ and Phox2B-Cre- mice. Graphs depict group level (C) body weight change, (D) clinical score over the course of IAV infection, (E) lung viral titers, (F) lung cytokine measurements and (G) lung immune cell populations at day 6 IAV post infection following nodose lung sensory neuron ablation. Data represented as mean ± SEM. *, **, ***, **** denotes significance of p < 0.05, p < 0.01, p < 0.001, p < 0.0001, respectively, as (B, E, F, G) determined by Mann-Whitney t-test and (C, D) repeated measures two-way ANOVA corrected for multiple comparisons (Šídák). dmnx, dorsal motor nucleus of the vagus; XII, hypoglossal motor nucleus. N, neutrophils; DC, dendritic cells; AM, alveolar macrophages; IM, interstitial macrophages; B, B cells; NK, natural killer cells. Scale bar represents 100 μm. Cartoons were created with BioRender.com.
Fig 5
Fig 5. Pharmacological inhibition of pulmonary sensory neuron activity during IAV infection increases morbidity.
(A) Schematic outlining experimental design used to assess the effect of nebulized QX-314 on IAV morbidity. Graphs depict group level (B) body weight change, (C) clinical scoring and (D) respiratory parameters measured post infection with IAV following administration of QX-314 or vehicle. N = 10 for each group at 4, 6, 8 days post infection. Data represented as mean ± SEM. *, **, ***, **** denotes significance of p < 0.05, p < 0.01, p < 0.001, p < 0.0001, respectively, as (B) determined by repeated measures two-way ANOVA corrected for multiple comparisons (Šídák). Freq, frequency; TV, tidal volume; MV, minute volume; PENH, enhanced pause; PAU, pause; Rpef, location into expiration where the peak occurs (PEF) as a fraction of Te; PIF, peak inspiratory flow; PEF, peak expiratory flow; Ti, inspiratory time; Te, expiratory time; EF50, expiratory flow at 50% expired volume;Tr, relaxation time; TB, duration of breaking; TP, duration of pause before expiration. Cartoons were created with BioRender.com.
Fig 6
Fig 6. Pharmacological inhibition of pulmonary sensory neuron activity impacts IAV lung pathogenesis.
Graphs depict group level (A) lung cytokines, (B) lung viral titers post infection and (C) lung immune cell populations IAV following administration of QX-314 or vehicle. N = 5–10 for each group at 4, 6, 8 days post infection. Data represented as mean ± SEM. *, **, ***, **** denotes significance of p < 0.05, p < 0.01, p < 0.001, p < 0.0001, respectively, as determined by repeated measures two-way ANOVA corrected for multiple comparisons (Šídák). N, neutrophils; DC, dendritic cells; AM, alveolar macrophages; IM, interstitial macrophages; B, B cells; NK, natural killer cells.
Fig 7
Fig 7. Pharmacological inhibition of pulmonary sensory neuron activity during IAV infection and impacted lung pathology.
Images and represent hematoxylin and eosin-stained lung sections obtained from mice administered either QX-314 or vehicle at days (A) 4, (B), 6 or (C) 8 post mock or IAV infection. Graphs represent histopathological lung scoring of each criteria (left) and the subsequent total score (right) for QX-314 or vehicle administered IAV infected mice at days (A) 4, (B) 6, or (C) 8 post IAV infection. Data represented as mean ± SEM. *, **, **** denotes significance of p < 0.05, p < 0.01, p < 0.0001, respectively, as determined by repeated measures two-way ANOVA corrected for multiple comparisons (Šídák). Interstitial leukocyte infiltration (black asterisk), alveolitis (blue asterisk), leukocyte and transmural margination (black arrowheads), bronchiolitis (yellow arrowhead), perivascular lymphocyte infiltration (blue arrowheads). LM, leukocyte margination; TM, transmural migration; PI, perivascular infiltration; B, bronchitis, bronchiolitis; II, interstitial inflammation; Al, alveolar inflammation; PH, pneumocyte hypertrophy/ hyperplasia; P, pleuritis. Scale bar at low magnification 1,500 μM and high magnification 300 μM.
Fig 8
Fig 8. Pharmacological inhibition of pulmonary sensory neuron activity during IAV infection results in a hyperinflammatory state within the vagal sensory ganglia.
Graphs depict group level qPCR analysis of (A) neuropeptide and host defense/ proinflammatory associated genes, and (B) viral mRNA levels present in the vagal sensory ganglia during IAV infection in mice that received either vehicle (black circles) or QX-314 (red circles). Data expressed as fold change in expression values relative to matched mock group. Representative immunofluorescence images of the vagal sensory ganglia at day 6 post-infection demonstrating an increase in the number of MHC II+ immune cells in mice administered either (C) vehicle or (C’) QX-314 (MHC II, green; sensory neurons immunolabeled with MAP2, purple). The bar graph (C”) shows the percentage increase of MHC II+ cells per total number of MAP2+ neurons in the vagal sensory ganglia of vehicle (black circles) and QX-314 (red circles) IAV infected mice. Representative immunofluorescence images of the vagal sensory ganglia demonstrating an increase in the number of CGRP-expressing neurons in IAV infected mice that received (D’) QX-314 compared to mice receiving vehicle (D). The bar graph (D”) shows the percentage increase of CGRP-expressing neurons (red) per the total number of MAP2 neurons (purple) in the in the vagal sensory ganglia of vehicle (black circles) and QX-314 (red circles) IAV infected mice. Data represented as mean ± SEM. *, **, ***, **** denotes significance of p < 0.05, p < 0.01, p < 0.001, p < 0.0001, respectively, as (A, B, C”, D”) determined by repeated measures two-way ANOVA or mixed-effects analysis corrected for multiple comparisons (Šídák). Scale bar represents 100μm.

References

    1. Peteranderl C., Herold S., and Schmoldt C. Human Influenza Virus Infections. Semin Respir Crit Care Med, 2016. 37(4): p. 487–500. doi: 10.1055/s-0036-1584801 - DOI - PMC - PubMed
    1. Uyeki T., Hui S., Zambon M., Wentworth D., and Monto A. Influenza . Lancet, 2022. 400(10353): p. 693–706. doi: 10.1016/S0140-6736(22)00982-5 - DOI - PMC - PubMed
    1. Canning B., Mori N., and Mazzone S. Vagal afferent nerves regulating the cough reflex. Respir Physiol Neurobiol, 2006. 152(3): p. 223–42. doi: 10.1016/j.resp.2006.03.001 - DOI - PubMed
    1. Mazzone S., and Undem B. Vagal Afferent Innervation of the Airways in Health and Disease. Physiol Rev, 2016. 96(3): p. 975–1024. doi: 10.1152/physrev.00039.2015 - DOI - PMC - PubMed
    1. Kupari J., Haring M., Agirre E., Castelo-Branco G., and Ernfors P. An Atlas of Vagal Sensory Neurons and Their Molecular Specialization. Cell Rep, 2019. 27(8): p. 2508–2523 e4. doi: 10.1016/j.celrep.2019.04.096 - DOI - PMC - PubMed

Publication types