. 2024 May 29;120(7):756-768.
doi: 10.1093/cvr/cvae068.

ATP13A3 variants promote pulmonary arterial hypertension by disrupting polyamine transport

Affiliations

ATP13A3 variants promote pulmonary arterial hypertension by disrupting polyamine transport

Bin Liu et al. Cardiovasc Res. .

Abstract

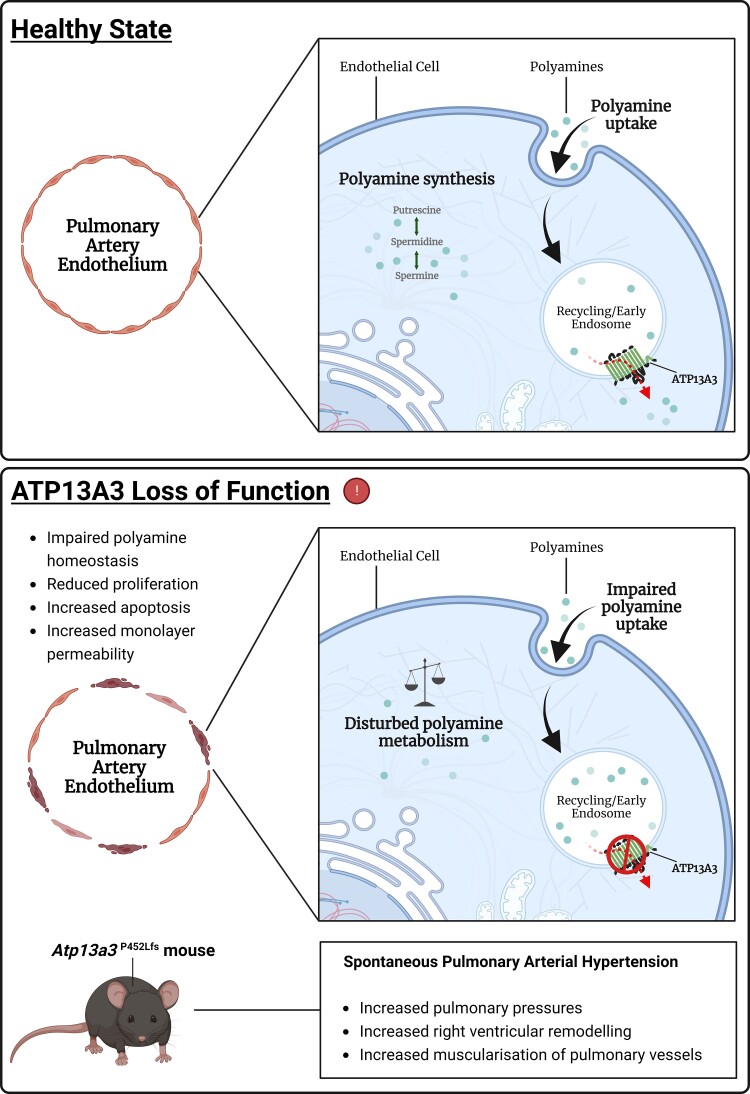
Aims: Potential loss-of-function variants of ATP13A3, the gene encoding a P5B-type transport ATPase of undefined function, were recently identified in patients with pulmonary arterial hypertension (PAH). ATP13A3 is implicated in polyamine transport but its function has not been fully elucidated. In this study, we sought to determine the biological function of ATP13A3 in vascular endothelial cells (ECs) and how PAH-associated variants may contribute to disease pathogenesis.

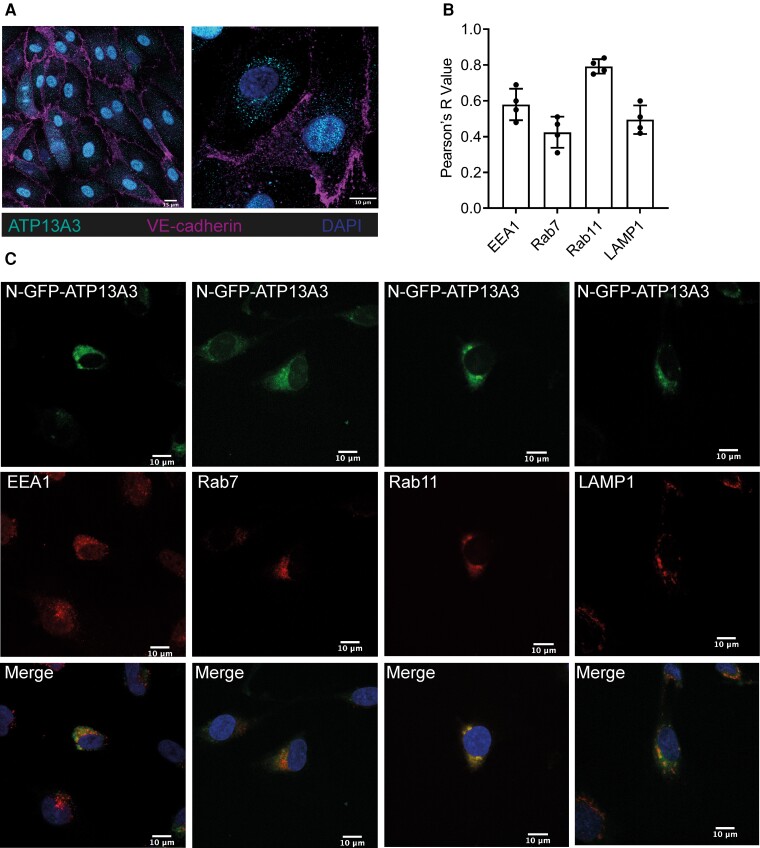
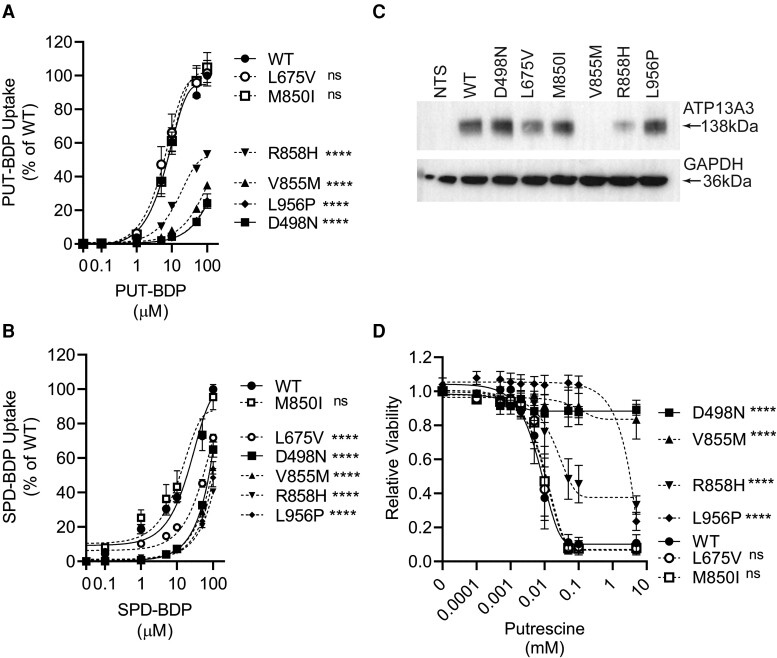
Methods and results: We studied the impact of ATP13A3 deficiency and overexpression in EC models [human pulmonary ECs, blood outgrowth ECs (BOECs), and human microvascular EC 1], including a PAH patient-derived BOEC line harbouring an ATP13A3 variant (LK726X). We also generated mice harbouring an Atp13a3 variant analogous to a human disease-associated variant to establish whether these mice develop PAH. ATP13A3 localized to the recycling endosomes of human ECs. Knockdown of ATP13A3 in ECs generally reduced the basal polyamine content and altered the expression of enzymes involved in polyamine metabolism. Conversely, overexpression of wild-type ATP13A3 increased polyamine uptake. Functionally, loss of ATP13A3 was associated with reduced EC proliferation, increased apoptosis in serum starvation, and increased monolayer permeability to thrombin. The assessment of five PAH-associated missense ATP13A3 variants (L675V, M850I, V855M, R858H, and L956P) confirmed loss-of-function phenotypes represented by impaired polyamine transport and dysregulated EC function. Furthermore, mice carrying a heterozygous germline Atp13a3 frameshift variant representing a human variant spontaneously developed a PAH phenotype, with increased pulmonary pressures, right ventricular remodelling, and muscularization of pulmonary vessels.

Conclusion: We identify ATP13A3 as a polyamine transporter controlling polyamine homeostasis in ECs, a deficiency of which leads to EC dysfunction and predisposes to PAH. This suggests a need for targeted therapies to alleviate the imbalances in polyamine homeostasis and EC dysfunction in PAH.

Keywords: ATP13A3; Polyamines; Pulmonary arterial hypertension.


Conflict of interest statement

Conflict of interest: P.D.U. and N.W.M. have published US (US10336800) and EU (EP3166628B1) patents entitled: ‘Therapeutic Use of Bone Morphogenetic Proteins’. All other authors declare no competing interests.

Figures

Graphical Abstract
Graphical Abstract
Figure 1
Figure 1
ATP13A3 is a polyamine transporter residing in the recycling endosome of ECs. (A) Confocal images at ×40 (left panel, scale bar = 15 µm) and ×63 (right panel, scale bar = 10 µm) of hPAECs costained with anti-ATP13A3 and anti-VE-Cadherin. (B) Pearson’s coefficients of the correlation of GFP-tagged ATP13A3 to different endosomal markers in HMEC-1 cells. (C) Confocal images (×63, scale bar = 10 µm) of HMEC-1 cells transiently overexpressing hATP13A3-N-GFP-pcDNA6.2 costained with antibodies against EEA1, Rab7, Rab11, or LAMP1. The data are representative of n = 4 experiments.
Figure 2
Figure 2
ATP13A3 deficiency impairs polyamine transport in ECs. (A) Cellular PUT, SPD, and SPM levels in hPAECs measured by LC–MS. Cells were transfected with DharmaFECT 1™ (DH1, Cambridge, UK) alone, siATP13A3, or non-targeting siRNA control (siCP) and cultured overnight in EBM2 containing 2% FBS supplemented with or without 1 mM PUT, 10 µM, SPD, or 10 µM SPM. The data (n = 3 experiments) are presented as polyamine peak area ratio relative to 2% FBS DH1. (B) Western blot showing ATP13A3 protein expression in parental, non-transduced, and HMEC-1 cells stably expressing miRNAs targeting ATP13A3 (miR1–miR4), with miR-FLUC (Firefly Luciferase) as a control. (C) BDP-labelled polyamine uptake in HMEC-1 stable knockdown lines (n = 4 experiments, two technical replicates per experiment). The data are normalized to the mean fluorescent intensities of miR-FLUC. (D) Confocal microscopy depicting the uptake and distribution of PUT-BDP in HMEC-1 cells, expressing miR-FLUC and ATP13A3 miR3 following 2 h treatment with PUT-BDP (scale bar = 10 µm). (A, C) The data (mean ± SEM) were analysed using a one-way ANOVA with Tukey’s post hoc test for multiple comparisons. *P < 0.05, **P < 0.01, ****P < 0.0001.
Figure 3
Figure 3
ATP13A3 deficiency affects polyamine metabolism in hPAECs. (A) Immunoblotting for ATP13A3 and ODC1 in hPAECs after transfection with DH1 alone, siATP13A3, or non-targeting siCP. (B, C) Transcription of (B) ODC1, OAZ1, AZIN1, and polyamine biosynthesis enzymes (ARG1, SRM, SMS, and AMD1) and (C) catabolic enzymes (SMOX, PAO, and SAT1) in hPAECs transfected with DH1, siATP13A3, or siCP. The data (n = 4 experiments) are fold-change relative to the DH1 control for each transcript. (B, C) The data (mean ± SEM) were analysed using a one-way ANOVA with Tukey’s post hoc test for multiple comparisons. *P < 0.05 compared with siCP.
Figure 4
Figure 4
ATP13A3 deficiency leads to endothelial dysfunction. (A) Proliferation, determined by cell counting, of transfected hPAECs over 6 days in EBM2 with 2% FBS, with media replenished every 2 days. (B) Transcription of CCND, CCNE, CCNA, and CCNB mRNAs with ATP13A3 deficiency assessed by quantitative polymerase chain reaction. The data are fold-change relative to the DH1 control for each transcript. (C) Apoptosis assessed by Caspase-Glo®3/7 assay (Promega, Madison, NI) of transfected hPAECs cultured in EBM2 with 0.1% FBS or 2% FBS. (D) Permeability of transfected hPAEC monolayers to horseradish peroxidase in the absence or presence of 1 U/mL thrombin assessed by colorimetric assay. The data are the raw absorbance values for the different groups at the 2 h time point. The data (n = 4 experiments) in AD are mean ± SEM and were analysed using a one-way ANOVA with Tukey’s post hoc test for multiple comparisons. *P < 0.05, **P < 0.01 compared with siCP.
Figure 5
Figure 5
PAH-associated ATP13A3 variants exhibit deficient polyamine uptake. (A, B) Flow-cytometric analysis for the assessment of cellular uptake of increasing concentrations of (A) PUT-BDP (n = 5 experiments) and (B) SPD-BDP (n = 6 experiments) after 30 min exposure. The data are normalized to WT. (C) Western blot showing ATP13A3 protein expression in non-transduced (NTS) HMEC-1 cells compared with those stably expressing untagged ATP13A3-WT (WT), an artificial transport dead mutant (D498N) or five PAH-associated variants (L675V, M850I, V855M, R858H, and L956P). (D) Cytotoxicity (MUH reagent) assay with a concentration–response analysis to PUT (n = 4 experiments). (A, B, D) The data were analysed by two-way ANOVA followed by multiple comparisons using Tukey’s post hoc tests. ****P < 0.00005 and ns = non-significant.
Figure 6
Figure 6
The ATP13A3 LK726X frameshift variant predisposes BOECs to apoptosis by affecting ATP13A3-mediated polyamine transport. (A) Immunoblotting of ATP13A3 in control BOECs (C4, C7, C35) and ATP13A3LK726X BOECs. Densitometric analysis of ATP13A3 and α-tubulin was performed (graph, n = 4 experiments). (B) Cellular polyamine contents, measured by LC–MS, of BOECs in media or supplemented with 1 mM PUT, 10 µM SPD, or 10 µM SPM. The data (n = 3 experiments) are presented as polyamine peak area ratio relative to the C4 control BOEC line. (C) BOEC uptake of PUT-BDP, SPD-BDP, and SPM-BDP measured by flow cytometry (n = 3 experiments, two technical replicates per experiment). (D) Cell apoptosis of BOECs cultured in EBM2 supplemented with 1% FBS or 5% FBS was assessed by Caspase-Glo®3/7 assay (n = 5 experiments). The data are normalized to cells cultured in EGM2 containing 10% FBS. (A–D) The data are mean ± SEM analysed using (A, B, D) one-way ANOVA with Tukey’s post hoc test for multiple comparisons or (C) unpaired t-test. *P < 0.05, **P < 0.01, ****P < 0.0001 compared with ATP13A3LK726X.
Figure 7
Figure 7
Male mice harbouring an Atp13a3P452Lfs variant spontaneously develop PAH at 6 months of age. (A) Expression of Atp13a3 mRNA in whole lungs of male Atp13a3P452Lfs heterozygous (Het, n = 9) and homozygote (Hom, n = 4) mice compared with WT littermate controls (Wt, n = 6). (B) Invasive haemodynamic measurement of RVSP in male and female Atp13a3P452Lfs heterozygous and homozygous mice and WT littermate controls aged 3 or 6 months (numbers in bars). (C–F) Further comparison of male heterozygous Atp13a3P452Lfs mice and WT littermate controls aged 6 months. (C) The assessment of vessel muscularization of arterioles <50 μm in diameter (n = 4 Wt and 10 Het mice, n = 12–33 vessels/lung) as indicated by arrows in the respective α-smooth muscle actin immunostaining panels (scale bars = 100 µm). (D) Ratio of RV weight to bodyweight (BW) (n = 9, 8). (E) Wheat-germ agglutinin staining of cardiomyocytes in heart sections (scale bar = 50 µm) from which the cardiomyocyte cross-sectional areas were measured (graph, n = 6 per group). (F) RV fibrosis in picrosirius red-stained sections (panels show representative images, scale bar = 250 µm). Fibrosis was measured as the percentage of red staining in isolated RV images (11–20 images per heart, n = 6 animals per group). The data are mean ± SEM and were analysed with: (A) one-way ANOVA with Tukey’s multiple comparison test; (B) Kruskal–Wallis test with multiple comparisons or: (C–F) a two-tailed unpaired t-test with Welch’s correction. *P < 0.05, **P < 0.005, ***P < 0.0005, ****P < 0.0001.

References

    1. Humbert M, Guignabert C, Bonnet S, Dorfmüller P, Klinger JR, Nicolls MR, Olschewski AJ, Pullamsetti SS, Schermuly RT, Stenmark KR, Rabinovitch M. Pathology and pathobiology of pulmonary hypertension: state of the art and research perspectives. Eur Respir J 2019;53:1801887. - PMC - PubMed
    1. Long L, Ormiston ML, Yang X, Southwood M, Gräf S, Machado RD, Mueller M, Kinzel B, Yung LM, Wilkinson JM, Moore SD, Drake KM, Aldred MA, Yu PB, Upton PD, Morrell NW. Selective enhancement of endothelial BMPR-II with BMP9 reverses pulmonary arterial hypertension. Nat Med 2015;21:777–785. - PMC - PubMed
    1. Lane KB, Machado RD, Pauciulo MW, Thomson JR, Phillips JA III, Loyd JE, Nichols WC, Trembath RC. Heterozygous germline mutations in BMPR2, encoding a TGF-beta receptor, cause familial primary pulmonary hypertension. The International PPH Consortium. Nat Genet 2000;26:81–84. - PubMed
    1. Deng Z, Morse JH, Slager SL, Cuervo N, Moore KJ, Venetos G, Kalachikov S, Cayanis E, Fischer SG, Barst RJ, Hodge SE, Knowles JA. Familial primary pulmonary hypertension (gene PPH1) is caused by mutations in the bone morphogenetic protein receptor-II gene. Am J Hum Genet 2000;67:737–744. - PMC - PubMed
    1. Southgate L, Machado RD, Gräf S, Morrell NW. Molecular genetic framework underlying pulmonary arterial hypertension. Nat Rev Cardiol 2020;17:85–95. - PubMed

Publication types

MeSH terms