Comparative Study
. 2024 May:174:108448.
doi: 10.1016/j.compbiomed.2024.108448. Epub 2024 Apr 10.

Hepatic steatosis modeling and MRI signal simulations for comparison of single- and dual-R2* models and estimation of fat fraction at 1.5T and 3T

Affiliations
Comparative Study

Hepatic steatosis modeling and MRI signal simulations for comparison of single- and dual-R2* models and estimation of fat fraction at 1.5T and 3T

Utsav Shrestha et al. Comput Biol Med. 2024 May.

Abstract

Background and objective: Magnetic resonance imaging (MRI) has emerged as a noninvasive clinical tool for assessment of hepatic steatosis. Multi-spectral fat-water MRI models, incorporating single or dual transverse relaxation decay rate(s) (R2*) have been proposed for accurate fat fraction (FF) estimation. However, it is still unclear whether single- or dual-R2* model accurately mimics in vivo signal decay for precise FF estimation and the impact of signal-to-noise ratio (SNR) on each model performance. Hence, this study aims to construct virtual steatosis models and synthesize MRI signals with different SNRs to systematically evaluate the accuracy of single- and dual-R2* models for FF and R2* estimations at 1.5T and 3.0T.

Methods: Realistic hepatic steatosis models encompassing clinical FF range (0-60 %) were created using morphological features of fat droplets (FDs) extracted from human liver biopsy samples. MRI signals were synthesized using Monte Carlo simulations for noise-free (SNRideal) and varying SNR conditions (5-100). Fat-water phantoms were scanned with different SNRs to validate simulation results. Fat water toolbox was used to calculate R2* and FF for both single- and dual-R2* models. The model accuracies in R2* and FF estimates were analyzed using linear regression, bias plot and heatmap analysis.

Results: The virtual steatosis model closely mimicked in vivo fat morphology and Monte Carlo simulation produced realistic MRI signals. For SNRideal and moderate-high SNRs, water R2* (R2*W) by dual-R2* and common R2* (R2*com) by single-R2* model showed an excellent agreement with slope close to unity (0.95-1.01) and R2 > 0.98 at both 1.5T and 3.0T. In simulations, the R2*com-FF and R2*W-FF relationships exhibited slopes similar to in vivo calibrations, confirming the accuracy of our virtual models. For SNRideal, fat R2* (R2*F) was similar to R2*W and dual-R2* model showed slightly higher accuracy in FF estimation. However, in the presence of noise, dual-R2* produced higher FF bias with decreasing SNR, while leading to only marginal improvement for high SNRs and in regions dominated by fat and water. In contrast, single-R2* model was robust and produced accurate FF estimations in simulations and phantom scans with clinical SNRs.

Conclusion: Our study demonstrates the feasibility of creating virtual steatosis models and generating MRI signals that mimic in vivo morphology and signal behavior. The single-R2* model consistently produced lower FF bias for clinical SNRs across entire FF range compared to dual-R2* model, hence signifying that single-R2* model is optimal for assessing hepatic steatosis.

Keywords: Fat fraction; Hepatic steatosis; Liver; Monte Carlo; R2*; Relaxometry; Simulation.


Conflict of interest statement

Declaration of competing interest The authors declare that they have no known competing financial interests or personal relationships that could have appeared to influence the work reported in this paper.

Figures

Figure 1.
Figure 1.
Gamma distribution function (GDF) fitting for fat droplet (FD) size, nearest neighbor (NN) distance and regional isotropy for three representative fat fractions (FF) (15%, 30% and 45%) with normalized root mean square error (NRMSE) values displayed. With increasing FF, the GDF fitting shows that the size and number of FDs increased causing the FDs to come closer and distribute evenly in different regions of the tissue. The overall NRMSE for GDF fitting for the three morphology characteristics are shown in table 1.
Figure 2.
Figure 2.
Illustration of virtual hepatic steatosis models generated for three representative fat fractions (FF) of 15%, 30% and 45%. The fat droplets (FDs) were placed in a 240X240X120 μm3 3D tissue environment based on regional isotropy and nearest neighbor (NN) distance spatial distributions. The top row shows the 3D virtual environment with each sub-cube representing a hepatocyte (20 μm side). The middle row represents the corresponding 2D 4 μm thick cross-sections. The opaque white circles indicate FDs on the surface of the slice and the semi-transparent circles denote FDs that are within the 4 μm slice but their centroid is not on the surface of the slice. The bottom row shows liver histology images (420X840 μm2) from patients with FF = 14.19, 30.29 and 44.37%, from left to right. Note that the scale of 2D simulation slice is different than the histology images.
Figure 3.
Figure 3.
Synthesized total MRI signals (water+fat) for three representative fat fractions (FF) of 15%, 30% and 45%, and SNRs of 15, 50 and 75 at 1.5T and 3.0T. The signals showed appropriate oscillations and signal decay, similar to in vivo MRI signal, with the amplitude of the oscillations increasing with increase in FF and the water and fat signals dephasing and decaying faster at higher field strength. The signal oscillations of the lowest SNR (SNR = 15) are highly distorted due to noise predominance.
Figure 4.
Figure 4.
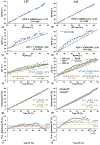
Linear regression analysis of the predicted R2* and fat fraction (FF) values for SNRideal signal using single- and dual-R2* models for FF ranging from 0-60%. (a, b) Common R2* (R2*com) vs R2* of water (R2*W) at 1.5T and 3.0T showed an excellent agreement with slopes close to unity. (c, d) R2*W vs R2* of fat (R2*F) at 1.5T and 3.0T demonstrated that R2*F is slightly higher than R2*W for majority of the cases. (e, f) R2*(s)-FF relationship at 1.5T and 3.0T showed a linear increasing trend and fell within 95% confidence interval (CI) of in vivo R2*-FF calibration. Plot comparing the single- and dual-R2* model estimated FF (g, h) and bias in the predicted FF (i, j) with true FF for the simulated SNRideal signal at 1.5T and 3.0T showed that both R2* models showed competitive accuracy with a relatively small bias in FF estimation. The color dotted lines represent linear regression lines and color dashed lines represent mean FF bias, black short-dashed line represents line of unity, black long-dashed line indicates the in vivo calibration and the black dotted line represents the 95% CI. (Note: Confidence intervals of slopes and intercepts are presented in Table S2).
Figure 5.
Figure 5.
Linear regression analysis of the predicted R2* values using single- and dual-R2* models for SNR 15, 50 and 75. (a, b) Common R2* (R2*com) vs R2* of water (R2*W) at 1.5T and 3.0T showed excellent agreement except for SNR = 15 at 3.0T. (c, d) R2*W vs R2* of fat (R2*F) at 1.5T and 3.0T demonstrate no relationship at SNR 15 but tending towards linear association with increasing SNR. (e, f) R2*com-FF and R2*W-FF relationship at 1.5T and 3.0T showed a linear increasing trend and fell within 95% confidence interval (CI) of in vivo R2*-FF calibration. (g, h) R2*F-FF relationship at 1.5T and 3.0T showed higher correlation with increasing SNR and field strength. The table at the bottom tabulates the results of linear regression with slope (m), intercept (c) and correlation coefficient (R2) for plots (e) and (f). The color dotted lines represent linear regression lines, black dashed and dotted lines represent the in vivo R2*-FF calibration and its 95% CI. (Note: Confidence intervals of slopes and intercepts are presented in Table S3).
Figure 6.
Figure 6.
Plot comparing the single- and dual-R2* model estimated fat fraction (FF) (a, b) and bias in the predicted FF (c, d) with true FF for the simulated signals for SNR 15, 50 and 75 at 1.5T (left column) and 3.0T (right column). The table at the bottom tabulates the slope (m), intercept (c) and correlation coefficient (R2) value for estimated FF vs true FF along with the descriptive statistics of FF estimation bias at 1.5T and 3.0T. The black dashed line represents the line of unity. Dual-R2* model shows relatively higher bias than single-R2* model at SNR 15. For SNR 50 and 75, dual-R2* model shows comparable accuracy in FF estimation to single-R2* model. (Note: Confidence intervals of slopes and intercepts are presented in Table S3).
Figure 7.
Figure 7.
Linear regression analysis of the predicted R2* values and fat fraction (FF) using single- and dual-R2* models for the phantom scans with SNRST8,NSA1 and SNRST8,NSA8. (a) Common R2* (R2*com) vs R2* of water (R2*W) showed a linear relationship with slope close to unity. (b) R2*W vs R2* of fat (R2*F) demonstrated no relationship. (c) R2*com-FF and R2*W-FF relationships showed a linear increasing trend and fell within 95% confidence interval (CI) of the in vivo R2*-FF calibration. Plot comparing the single- and dual-R2* model estimated FF (d) and bias in the predicted FF (e) with true FF demonstrating that both R2* models showed competitive accuracy with a relatively small bias in FF. The dotted and dashed lines represent linear regression lines and mean FF estimation bias, respectively. (Note: Confidence intervals of slopes and intercepts are presented in Table S4).
Figure 8.
Figure 8.
Heatmap comparing fat fraction (FF) estimation bias between the single- and dual-R2* correction models in simulations and phantom experiments. Single-R2* FF bias was subtracted from dual-R2* FF bias and the blue color (positive values) indicates the region where single-R2* bias is lower than dual-R2* and the orange color (negative values) indicates vice-versa. In simulations, the FF values ranged from 0-60% with 1% increments and signal-to-noise ratio (SNR) ranged from 5-100 with step size of 5. In phantoms, the FF ranged from 0-60% in 10% increments and 100% FF and SNRscaled ranged from 0.71 to 1.50. The FF bias difference between both the R2* models was small, with dual-R2* model showing slightly lower bias for high SNRs and in regions where fat and water signals are predominant whereas single-R2* model performing better for low SNRs and at low and high FF extremities.

References

    1. Chalasani N, Younossi Z, Lavine JE, Charlton M, Cusi K, Rinella M, Harrison SA, Brunt EM, Sanyal AJ, The diagnosis and management of nonalcoholic fatty liver disease: Practice guidance from the American Association for the Study of Liver Diseases, Hepatology, 67 (2018) 328–357. - PubMed
    1. Chen Y-Y, Yeh MM, Non-alcoholic fatty liver disease: A review with clinical and pathological correlation, Journal of the Formosan Medical Association, 120 (2021) 68–77. - PubMed
    1. Younossi ZM, Koenig AB, Abdelatif D, Fazel Y, Henry L, Wymer M, Global epidemiology of nonalcoholic fatty liver disease—Meta-analytic assessment of prevalence, incidence, and outcomes, Hepatology, 64 (2016) 73–84. - PubMed
    1. Vernon G, Baranova A, Younossi ZM, Systematic review: the epidemiology and natural history of non-alcoholic fatty liver disease and non-alcoholic steatohepatitis in adults, Alimentary Pharmacology & Therapeutics, 34 (2011) 274–285. - PubMed
    1. Angulo P, Nonalcoholic Fatty Liver Disease, New England Journal of Medicine, 346 (2002) 1221–1231. - PubMed

Publication types