. 2024 May 2;111(5):913-926.
doi: 10.1016/j.ajhg.2024.03.015. Epub 2024 Apr 15.

CAG repeat mosaicism is gene specific in spinocerebellar ataxias

Affiliations

CAG repeat mosaicism is gene specific in spinocerebellar ataxias

Radhia Kacher et al. Am J Hum Genet. .

Abstract

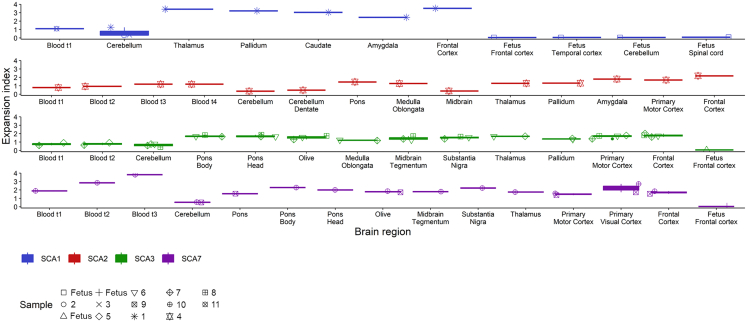
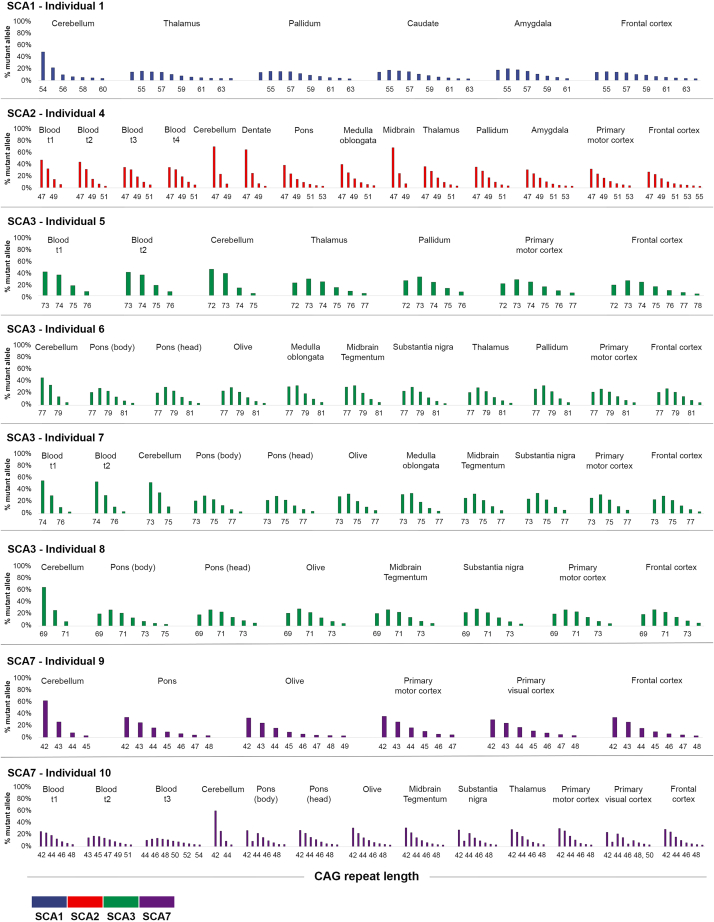
Expanded CAG repeats in coding regions of different genes are the most common cause of dominantly inherited spinocerebellar ataxias (SCAs). These repeats are unstable through the germline, and larger repeats lead to earlier onset. We measured somatic expansion in blood samples collected from 30 SCA1, 50 SCA2, 74 SCA3, and 30 SCA7 individuals over a mean interval of 8.5 years, along with postmortem tissues and fetal tissues from SCA1, SCA3, and SCA7 individuals to examine somatic expansion at different stages of life. We showed that somatic mosaicism in the blood increases over time. Expansion levels are significantly different among SCAs and correlate with CAG repeat lengths. The level of expansion is greater in individuals with SCA7 who manifest disease compared to that of those who do not yet display symptoms. Brain tissues from SCA individuals have larger expansions compared to the blood. The cerebellum has the lowest mosaicism among the studied brain regions, along with a high expression of ATXNs and DNA repair genes. This was the opposite in cortices, with the highest mosaicism and lower expression of ATXNs and DNA repair genes. Fetal cortices did not show repeat instability. This study shows that CAG repeats are increasingly unstable during life in the blood and the brain of SCA individuals, with gene- and tissue-specific patterns.

Keywords: ATXN1; ATXN2; ATXN3; ATXN7; CAG repeat; DNA repair; SCA; repeat expansion; somatic instability; spinocerebellar ataxia.


Conflict of interest statement

Declaration of interests The authors declare no competing interests.

Figures

Figure 1
Figure 1
Somatic expansion of the CAG repeats increases in the blood of SCA1, SCA2, SCA3, and SCA7 individuals (A) Individual trajectories of the EI across visits (up to eight visits) for each SCA group (one panel per group). The color gradient represents the range of CAG repeats in each group with darker shading indicating higher (CAG)n. Summary data are individuals' average characteristics (age and CAG repeats) at the first visit. For each value, the disease status is indicated with an empty circle (premanifest; before disease onset) or a filled circle (manifest; after disease onset). The dashed black regression line represents the progression of the EI as a function of age corresponding to the mean CAG(n) of the group, with the slope estimated using the emtrends function (emmeans R package) based on a mixed-effects model fit. For the four groups, the EI increases with age, with the most striking increase for SCA7 individuals, and the slowest increase for SCA3 individuals. (B) Longitudinal data plotted by (CAG)n, the color gradient represents the range of EI with darker shading indicating higher EI.
Figure 2
Figure 2
Residual ER correlates with disease status for SCA7 individuals Boxplots showing the distribution of the residual ER (i.e., corrected for [CAG]n) (A) between the individuals’ groups classified as premanifest (no clinical signs) and manifest (SARA >3.5 and/or pyramidal signs at examination), (B) or only based on the SARA score (preataxic <3.5, ataxic >3.5). Boxplots showing the distribution of the residual EI (i.e., corrected for age and (CAG)n) (C) between the individuals’ groups classified as premanifest (no clinical signs) and manifest (SARA >3.5 and/or pyramidal signs at examination) (D) or only based on the SARA score (preataxic <3.5, ataxic >3.5). p values of the two-sided Wilcoxon’s rank-sum tests are shown at the top of each plot.
Figure 3
Figure 3
The CAG repeat is somatically unstable in the postmortem brain of SCA1, SCA2, SCA3, and SCA7 individuals Boxplots of the EI measured in different postmortem brain structures. When only one sample was available, the value is plotted as one horizontal line instead of a boxplot. Fetal brain samples were available for SCA1, SCA3, and SCA7 and have the most stable repeat compared to the adult brain. Pathology and number for each individual is indicated at the bottom (matching data for each individual is available in Table 1). t1, first visit; t2, second visit; t3, third visit; t4, fourth visit.
Figure 4
Figure 4
Accumulation of larger CAG repeats in postmortem brains of SCA1, SCA2, SCA3, and SCA7 individuals We ascertained the “% mutant alleles” (as in Figure S1) from the peak heights from PCR profiles obtained on GeneMapper. Each additional peak corresponds to an additional CAG repeat. Pathology and number for each individual is indicated on top of each graph (matching data for each individual is available in Table 1). t1, first visit; t2, second visit; t3, third visit; t4, fourth visit.
Figure 5
Figure 5
The CAG repeat is somatically stable in the developing brain of SCA1, SCA3, and SCA7 fetus (A–C) (A) Comparison of mosaicism in four CNS region from a SCA1 fetus at 18 gestational weeks and blood of the parent; (B) the fetal cortex, trophoblast, and blood of the parent for an SCA3 fetus at 13 gestational weeks, (C) and a SCA7 fetus at 14 gestational weeks. We ascertained the “% mutant alleles” (as in Figure S1) from the peak heights from PCR profiles obtained on GeneMapper. (D) Detailed EI values with the corresponding modal CAG are indicated in a table.
Figure 6
Figure 6
Expression of DNA repair genes is tissue specific (A) DNA repair genes and ATXN expression was measured by real-time qPCR and plotted in a heatmap alongside EI on the left. For each disease, the corresponding ATXN was analyzed (ATXN1 for SCA1, ATXN2 for SCA2, ATXN3 for SCA3, ATXN7 for SCA7). Brain regions were grouped as follows: basal ganglia and related structures (amygdala, caudate, pallidum, thalamus), blood, cerebellum, fetus, cortex (frontal cortex, motor cortex, visual cortex), and brainstem (midbrain, substantia nigra, pons, olive, medulla oblongata). For visualization, the qPCR values were scaled to zero mean and unit variance (relative values from 4 to −4). SCA1: n = 1 (cerebellum: n = 3), SCA2: n = 1, SCA3: n = 3, SCA7: n = 2. (B) Expression levels obtained from the GTEx portal. RNA sequencing was performed on flash-frozen, non-diseased tissues; TPM, transcripts per kilo base million).

References

    1. Coarelli G., Coutelier M., Durr A. Autosomal dominant cerebellar ataxias: new genes and progress towards treatments. Lancet Neurol. 2023;22:735–749. doi: 10.1016/S1474-4422(23)00068-6. - DOI - PubMed
    1. Monin M.-L., Tezenas du Montcel S., Marelli C., Cazeneuve C., Charles P., Tallaksen C., Forlani S., Stevanin G., Brice A., Durr A. Survival and severity in dominant cerebellar ataxias. Ann. Clin. Transl. Neurol. 2015;2:202–207. doi: 10.1002/acn3.156. - DOI - PMC - PubMed
    1. Diallo A., Jacobi H., Tezenas du Montcel S., Klockgether T. Natural history of most common spinocerebellar ataxia: a systematic review and meta-analysis. J. Neurol. 2021;268:2749–2756. doi: 10.1007/s00415-020-09815-2. - DOI - PubMed
    1. Edamakanti C.R., Do J., Didonna A., Martina M., Opal P. Mutant ataxin1 disrupts cerebellar development in spinocerebellar ataxia type 1. J. Clin. Invest. 2018;128:2252–2265. doi: 10.1172/JCI96765. - DOI - PMC - PubMed
    1. Barnat M., Capizzi M., Aparicio E., Boluda S., Wennagel D., Kacher R., Kassem R., Lenoir S., Agasse F., Braz B.Y., et al. Huntington’s disease alters human neurodevelopment. Science. 2020;369:787–793. doi: 10.1126/science.aax3338. - DOI - PMC - PubMed

Publication types