Clinical Trial
. 2024 May 21;5(5):101516.
doi: 10.1016/j.xcrm.2024.101516. Epub 2024 Apr 15.

Neoantigen-targeted dendritic cell vaccination in lung cancer patients induces long-lived T cells exhibiting the full differentiation spectrum

Affiliations
Clinical Trial

Neoantigen-targeted dendritic cell vaccination in lung cancer patients induces long-lived T cells exhibiting the full differentiation spectrum

Joline Ingels et al. Cell Rep Med. .

Abstract

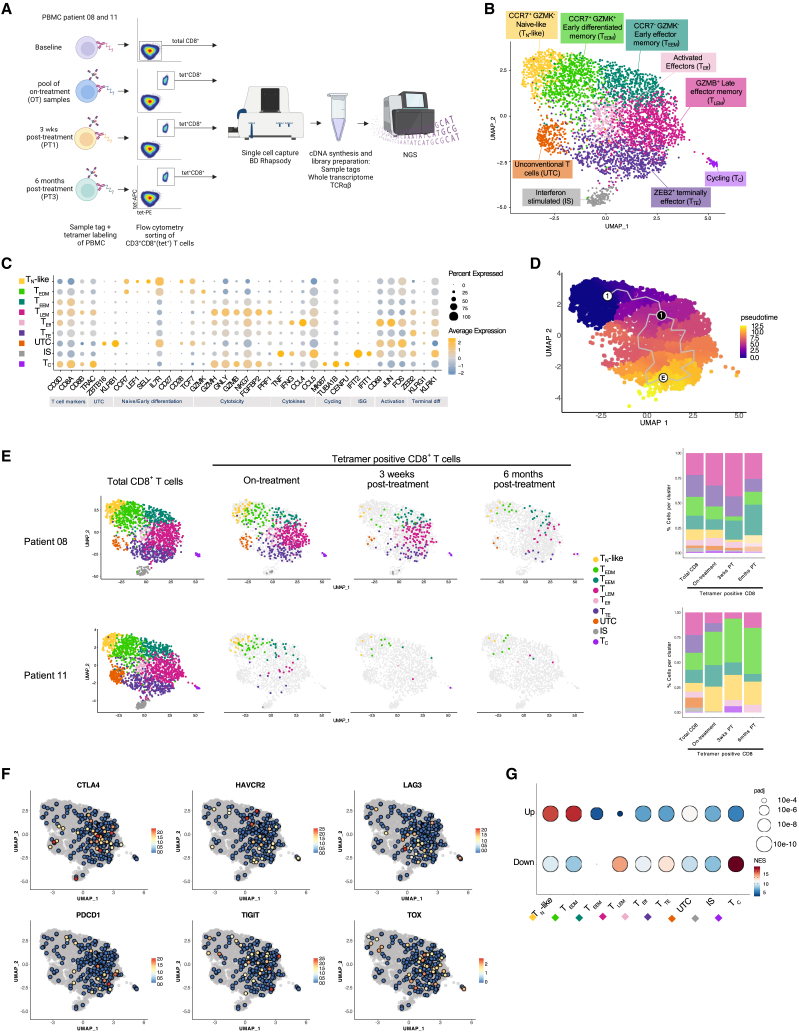
Non-small cell lung cancer (NSCLC) is known for high relapse rates despite resection in early stages. Here, we present the results of a phase I clinical trial in which a dendritic cell (DC) vaccine targeting patient-individual neoantigens is evaluated in patients with resected NSCLC. Vaccine manufacturing is feasible in six of 10 enrolled patients. Toxicity is limited to grade 1-2 adverse events. Systemic T cell responses are observed in five out of six vaccinated patients, with T cell responses remaining detectable up to 19 months post vaccination. Single-cell analysis indicates that the responsive T cell population is polyclonal and exhibits the near-entire spectrum of T cell differentiation states, including a naive-like state, but excluding exhausted cell states. Three of six vaccinated patients experience disease recurrence during the follow-up period of 2 years. Collectively, these data support the feasibility, safety, and immunogenicity of this treatment in resected NSCLC.

Keywords: T cell responses; cell therapy; clinical trial; dendritic cell vaccine; immunotherapy; neoantigens; non-small cell lung cancer; personalized vaccine.


Conflict of interest statement

Declaration of interests The authors declare no competing interests.

Figures

None
Graphical abstract
Figure 1
Figure 1
Vaccine manufacturing, clinical trial design, and neoantigen identification (A) Overview of the Neo-mDC manufacturing process. (B) Design of Neo-mRNA. (C) Overview of the clinical trial design. Time points of peripheral blood collection are indicated: baseline, B, 2 weeks after each dose (on treatment [OT1, after first; OT2, after second; OT3, after third; OT4, after fourth dose] and post treatment [PT1, 3 weeks; PT2, 3 months; PT3, 6 months; PT4, 1.5 years]). (D) Patient flow diagram. (E) Number of clonal variants for each patient as identified by Mutect2 and filtered based on VAF. (F) Number of clonal missense (purple) and frameshift (teal) variants per patient. (G) Identified HLA alleles per patient. Purple indicates the HLA alleles that are expressed in the tumor; green indicates HLA alleles lost by the tumor. (H) Total number of clonal variants that yield at least one strong binding neoepitope split in expressed (blue) and total (green). The black line indicates the minimum number of four neoepitopes producing clonal variants. (I) Overview of validation results for each vaccine-included neoantigen across all vaccinated patients. Purple and gray squares indicate neoantigen 25-mers with or without epitopes that were detected through immunopeptidomics or elicited TIL responses, respectively. White squares indicate that no analysis was performed. (J) Clinical event timeline from the time of NSCLC resection until time of death or end of follow-up.
Figure 2
Figure 2
Neo-mDC vaccination elicits neoantigen-specific T cell immunity at low dose levels (A) Scheme of the in vitro stimulation protocol. (B) Proportions of vaccine neoantigens inducing a CD4+ or CD8+ T cell response per individual patient (left) and across all patients (right). (C) Representative flow cytometry plots are shown, depicting IFN-γ expression in mINTS2-specific CD8+ T cells of patient 11 (left) and mLRRC47-specific CD4+ T cells of patient 08 (right). OT2, after second dose. (D) Proportions of immunogenic neoantigens that showed a T cell response (green) or did not show a T cell response (blue) before treatment across all patients. (E) Bar charts showing neoantigen-specific CD8+ and CD4+ T cell responses at each time point for each patient, with the percentages of neoantigen-specific T cell responses being stacked. Percentages are calculated based on two technical replicates. At the bottom of the figure, the abundance ranking of the tandem protein in the Neo-mDC batches is shown. (Table S4). N.A., not applicable.
Figure 3
Figure 3
Vaccine-induced T cell responses are mutant specific (A) Schematic overview of the protocol for detection of the minimal recognized epitope sequence. (B) For each 25-mer that induced a CD8+ T cell response, the amino acid sequences are shown of the full 25-mer, the predicted peptide sequence (green), and the individual 9/10/11-mers and 15-mers recognized by the T cells. For patient 03, a non-predicted epitope was found by MS (purple). If applicable, peptide sequences identified by MS-based immunopeptidomics (in tumor and TMG transgenic B-LCL cells) and TIL-recognized peptides are shown. The mutated amino acid is in bold; matching sequences are shaded. (C) CD137 expression of T cell lines enriched in specificity for mE2F7 (left) and mPTEN (right) after stimulation with a titration series of mutated (green) and corresponding wild-type (purple) peptide. The error bars indicate the standard error of the mean.
Figure 4
Figure 4
Vaccine-induced T cell responses exhibit diverse ex vivo differentiation phenotypes and persist for at least 1.5 years (A) Ex vivo pHLA-tetramer staining in CD8+ CD3+ T cells of peripheral blood collected at serial time points. Percentages indicate fraction CD8+ T cells that are positive in both fluorochromes, APC and PE. (B) Uniform manifold approximation and projection (UMAP) analysis reveals five clusters corresponding to T cell differentiation states. (C) Heatmaps of T cell differentiation markers. (D) Within the concatenate, CD3+CD8+Tet+ T cells are gated per time point and overlaid on the UMAP as purple dots. Total CD3+CD8+ not belonging to the tetramer+ gate are colored in gray. (E) Cluster distribution of the CD3+CD8+Tet+ cells in percentage over each time point per patient. (F) Left: strategy to gate TSCM. Right: percentages of TSCM within CD3+CD8+Tet+ gate.
Figure 5
Figure 5
Vaccine-induced T cells exhibit a continuum of transcriptional differentiation states (A) Schematic overview of the experimental setup. (B) UMAP analysis, with colors corresponding to the clusters identified by the Seurat algorithm. (C) Average expression of different gene sets for all clusters. (D) UMAP visualization of the Monocle3 pseudo-time analysis. (E) Left: UMAP visualization of the total CD8+ T cells and tetramer+ CD8+ T cells per time point. Colors correspond to the Seurat clustering. All cells not belonging to the specified population are colored in gray. Right: cluster distribution of the T cells in percentage over each time point. (F) Expression of checkpoint molecule genes and TOX in tetramer+ CD8+ T cells of the 3-weeks-post-treatment time point. (G) Normalized enrichment score (NES) of the different T cell clusters for the differentially up- and downregulated gene sets in memory T cells from 4 to 13 years after yellow fever vaccination.
Figure 6
Figure 6
Single-cell TCR sequencing reveals a polyclonal vaccine-induced T cell response (A) Overlap of the different genomic TCRVβ sequences of the tetramer+ T cells for the serial time points per patient. (B) Clonal distribution per size. (C) Clonotype tracking plot of the TCRVβ sequences of patient 08. Only sequences shared between at least two time points were used for the plot and the proportion calculation. (D) Distribution of the three shared TCRVβ clones of patient 08 over the transcriptome clusters. Cell number per time point is reflected in the number of slices.

References

    1. Travis W.D., Brambilla E., Nicholson A.G., Yatabe Y., Austin J.H.M., Beasley M.B., Chirieac L.R., Dacic S., Duhig E., Flieder D.B., et al. The 2015 World Health Organization Classification of Lung Tumors. J. Thorac. Oncol. 2015;10:1243–1260. doi: 10.1097/JTO.0000000000000630. - DOI - PubMed
    1. Siegel R.L., Miller K.D., Jemal A. Cancer statistics, 2017. CA A Cancer J. Clin. 2017;67:7–30. doi: 10.3322/caac.21387. - DOI - PubMed
    1. Howington J.A., Blum M.G., Chang A.C., Balekian A.A., Murthy S.C. Treatment of Stage I and II Non-small Cell Lung Cancer. Chest. 2013;143:e278S–e313S. doi: 10.1378/chest.12-2359. - DOI - PubMed
    1. Indini A., Rijavec E., Bareggi C., Grossi F. Novel treatment strategies for early-stage lung cancer: the oncologist’s perspective. J. Thorac. Dis. 2020;12:3390–3398. doi: 10.21037/jtd.2020.02.46. - DOI - PMC - PubMed
    1. Forde P.M., Spicer J., Lu S., Provencio M., Mitsudomi T., Awad M.M., Felip E., Broderick S.R., Brahmer J.R., Swanson S.J., et al. Neoadjuvant Nivolumab plus Chemotherapy in Resectable Lung Cancer. N. Engl. J. Med. 2022;386:1973–1985. doi: 10.1056/NEJMoa2202170. - DOI - PMC - PubMed

Publication types