. 2024 May 2;31(5):676-693.e10.
doi: 10.1016/j.stem.2024.03.013. Epub 2024 Apr 15.

Osteopontin drives neuroinflammation and cell loss in MAPT-N279K frontotemporal dementia patient neurons

Affiliations

Osteopontin drives neuroinflammation and cell loss in MAPT-N279K frontotemporal dementia patient neurons

Osama Al-Dalahmah et al. Cell Stem Cell. .

Abstract

Frontotemporal dementia (FTD) is an incurable group of early-onset dementias that can be caused by the deposition of hyperphosphorylated tau in patient brains. However, the mechanisms leading to neurodegeneration remain largely unknown. Here, we combined single-cell analyses of FTD patient brains with a stem cell culture and transplantation model of FTD. We identified disease phenotypes in FTD neurons carrying the MAPT-N279K mutation, which were related to oxidative stress, oxidative phosphorylation, and neuroinflammation with an upregulation of the inflammation-associated protein osteopontin (OPN). Human FTD neurons survived less and elicited an increased microglial response after transplantation into the mouse forebrain, which we further characterized by single nucleus RNA sequencing of microdissected grafts. Notably, downregulation of OPN in engrafted FTD neurons resulted in improved engraftment and reduced microglial infiltration, indicating an immune-modulatory role of OPN in patient neurons, which may represent a potential therapeutic target in FTD.

Keywords: FTD; MAPT N279K; OPN; Spp1; Tau; disease modeling; frontotemporal dementia; induced pluripotent stem cells; microglia; neuroinflammation; osteopontin; single nucleus RNA sequencing; snRNA-seq; transplantation.


Conflict of interest statement

Declaration of interests Z.K.W. serves as PI or co-PI on Biohaven Pharmaceuticals, Inc. (BHV4157-206), Vigil Neuroscience, Inc. (VGL101-01.002, VGL101-01.201), and ONO-2808-03 projects/grants. He serves as co-PI of the Mayo Clinic APDA Center for Advanced Research and as an external advisory board member for Vigil Neuroscience, Inc. and as a consultant for Eli Lilly & Company and for NovoGlia, Inc.

Figures

Figure 1.
Figure 1.. Histology and bulk RNA expression analysis of postmortem FTD and Ctrl substantia nigra.
(A) Hematoxylin and eosin (H&E) stained sections of the substantia nigra of a Ctrl and of an FTD patient. CP: Cerebral peduncle; SN: Substantia nigra; Teg; tegmentum. (B) Quantification of the area of the pars compacta (PC). (C) Quantification of the area of the pars reticulata (PR). (D) H&E-stained sections of Ctrl and FTD SN with higher magnification. (E) Quantification of neurons in the PC. (F) Quantification of neurons in the PR. (G) AT8 (p-tau)-stained sections of the FTD SN with higher magnification. (H) Quantification of glial cells in the PC. (I) Quantification of glial cells in the PR. (J) CD68-stained sections of Ctrl and FTD SN with higher magnification. (K) Quantification of CD68+ cells in the PC. (L) Quantification of CD68+ cells in the PR. (M) Heatmap of the top DEGs in the SN of FTD patients compared to Ctrl individuals. (N) KEGG pathway enrichment analysis of genes increased in FTD versus Ctrl. Representative members of select pathway cluster are shown. The x- and y-axes show the normalized enrichment values and the negative log10 of the adjusted p-value, respectively. The adjusted p-value and number of genes are also denoted by color and by size, respectively. Scale bars: 2 mm (A), 100μm (left images in D, G and J) and 50μm (right images in D, G and J). *p < 0.05, **p < 0.01, ***p < 0.001, ****p < 0.0001 - two-tailed Student’s t-test. Data are presented as mean + SEM.
Figure 2.
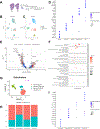
Figure 2.. Transcriptional pathology in nigral FTD neurons.
(A) Cartoon illustration of the study design. (B) UMAP plots of FTD and Ctrl nuclei color-coded by condition. (C) UMAP plot of FTD and Ctrl neuronal nuclei color-coded by lineage. OPC: oligodendrocyte precursor cells. (D) Dot plot graph showing the expression of lineage-associated genes. (E) Volcano plot showing DEGs between FTD and Ctrl donor neurons. (F) KEGG pathway enrichment analysis of the genes increased in FTD neurons. The plot is generated as in Figure 1N. (G) UMAP plot highlighting four neuronal subclusters (DA, RBFOX1, CALB2 and Inh). (H) Relative distribution of the four neuronal subclusters in the FTD and Ctrl groups. (I) Dot plot graph showing the expression of signature genes. See also Figure S1.
Figure 3.
Figure 3.. FTD patient iPSC-derived neurons show tau pathology and increased oxidative stress, cellular respiration and neuroinflammation.
(A) Immunostainings for TUJ1 and TH. (B) Immunostainings for TUJ1 and GABA. A-B: Nuclei are labeled with DAPI. (C) Immunostainings for TH and SV-2. (D) Immunostainings for TH and AT8. (E) Quantification of AT8+ DA neurons in neuronal cultures. (F) MTS assay with rotenone (200nM), oligomycin (10nM) and antimycin A (5nM). (G-I) Seahorse assays for different FTD and Ctrl iPSC clones. (J) Seahorse assay demonstrating rescue of increased respiration by metformin. (K) Enrichment plot showing that metformin treatment in FTD iPSC neurons leads to depletion of DEGs upregulated in neurons in postmortem FTD brains. (L) Heatmap showing the mass spectrometry expression data for about 150 polar metabolites in FTD versus Ctrl neurons. (M) Quantification of ATP in FTD and Ctrl neurons. (N) Top 20 metabolomics pathways enriched in FTD neurons. (O) Schematic presentation of the intermediary metabolism with glucose, glutamine and fatty acids as energy fuels (in red). Shown are unlabeled 12C-glucose carbons (black) and 13C-glucose carbons (blue) and how the latter are transferred among molecules of the TCA cycle. (P) Percentages of selected 13C-labeled and 12C-unlabeled metabolites after application of 13C-glucose to the medium of FTD and Ctrl neurons. (Q) Percentages as described for P, but after application of 13C-glutamine. (R) RT-qPCR for SPARC, C3 and SPP1. (S) Flow cytometry of FTD and Ctrl neurons using the CellRox assay to measure ROS production. (T) Quantification of relative ROS production in FTD and Ctrl neurons. (U) Flow cytometry of FTD neurons to measure ROS-production in the presence of absence of NAC using the CellRox assay. (V) Quantification of relative ROS production in vehicle- or NAC-treated FTD neurons. (W) RT-qPCR for SPP1 in vehicle or NAC-treated FTD neurons. Scale bars: 100μm (A and B), 50μm (C) and 25μm (D). *p < 0.05, **p < 0.01, ***p < 0.001, ****p < 0.0001 - two-tailed Student’s t-test (E,F,R,T,V,W) or Multiple t-test (P,Q). Data are presented as mean + SEM. See also Figures S2.and S3.
Figure 4.
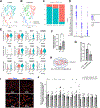
Figure 4.. Transcriptional pathology in postmortem FTD microglia and in cultured microglia after application of Osteopontin.
(A) UMAP plot of postmortem FTD and Ctrl microglial nuclei color-coded by condition. (B) As in A but color-coded by microglial subclusters. (C) Relative distribution of the three microglial subclusters in FTD and Ctrl microglia. (D) Dot plot graph showing the expression of most upregulated genes within the three microglial subclusters. (E) Violin plots of significantly upregulated genes in FTD microglia. (F) ELISA of the medium supernatant of cultured Ctrl or FTD neurons for Osteopontin. (G) Relative phagocytosis in microglial cell-line (HMC3) cultured in conditioned medium of FTD neurons in the presence or absence of an Osteopontin-blocking antibody. (H) Schematic drawing of the culture of human Ctrl and FTD iPSC-derived induced microglial cells (iMGLs) with treatment with Osteopontin. (I) Immunostainings of Ctrl and FTD iMGLs for Iba-1 with DAPI counterstaining. Scale bars: 100 μm for low-power images (top) and 50 μm for higher-power images (bottom). (J) RT-qPCR demonstrating relative expression of TNF and of indicated FTD microglia-associated DEGs in cultured Osteopontin-treated Ctrl (Ctrl-4, Ctrl-5 and Ctrl-6) and FTD (FTD-4, FTD-5 and FTD-6) iMGLs relative to vehicle-treated Ctrl and FTD iMGLs, respectively. *p < 0.05 - two-tailed Student’s t-test (F and G). #p < 0.05 and ##p < 0.01 (Ctrl iMGLs) and *p < 0.05, **p < 0.01 and ***p < 0.001 (FTD iMGLs) - one-tailed One Sample t-test (J). Data are presented as mean + SEM. See also Figures S1 and S3.
Figure 5.
Figure 5.. Transplantation of FTD and Ctrl neural cells into the brains of adult mice.
(A) Schematic drawing of the injection of FTD and Ctrl NPCs into the mouse brain. (B) Quantification of the size of grafts. (C) Quantification of surviving neurons in grafts. (D) Immunostainings of Ctrl grafts for HNA (human nuclear antigen) and NeuN. (E) Immunostainings of FTD grafts for HNA and NeuN. (F) H&E-stained section of a mouse brain with an FTD graft. LV, lateral ventricle; ctx, cortex; cc, corpus callosum; str, striatum; g, graft. (G) Immunostainings of grafts for human NCAM. (H) Immunostainings of grafts for synaptophysin. (I) Immunostainings of the center of grafts for GFAP and Iba-1. (J) Quantification of GFAP signal intensity within grafts. (K) Quantification of host microglia within grafts. (L) Immunostainings of the graft-host interface for GFAP and Iba-1. D-E, I, L: Nuclei are labeled with DAPI. (M) Quantification of GFAP signal intensity at the graft-host interface in the FTD and Ctrl groups. (N) Quantification of host microglia at the graft-host interface in the FTD and Ctrl groups. (O) Immunostainings of grafts for HNA and NeuN with high power view showing HNA+/NeuN+ grafted neurons and HNA/NeuN+ host neurons. (P) Quantification of HNA/NeuN+ host neurons within grafts. Scale bars: 20 μm (D and E), 500 μm (F), 50 μm (G, H, I and L), and 10 μm (O). *p < 0.05 and **p < 0.01 – two-tailed Student’s t-test. Data are presented as mean + SEM. See also Figure S4.
Figure 6.
Figure 6.. snRNA-seq of microdissected FTD and Ctrl grafts.
(A) Schematic drawing of the experimental approach. (B) UMAP plot of nuclei from microdissected FTD and Ctrl grafts color-coded by species. (C) UMAP plot of human nuclei color-coded by lineage. (D) As in C but color-coded by condition. (E) KEGG pathway enrichment analysis of the genes increased in grafted FTD neurons. The plot is generated as in Figure 1N. (F) Heatmap showing the Pearson correlation coefficients between transplanted FTD neurons, transplanted Ctrl neurons, postmortem FTD neurons and postmortem Ctrl neurons. (G) Histograms showing the enrichment scores of genes increased in postmortem FTD neurons demonstrated in engrafted FTD and Ctrl iPSC-derived neurons. (H) UMAP plot of grafted FTD and Ctrl neurons, and of postmortem FTD and Ctrl neurons color-coded by group. (I) UMAP plot of mouse nuclei within and adjacent to microdissected grafts color-coded by cell type. (J) Proportion of resting and activated mouse microglia within and adjacent to grafts. (K) As in F, but for mouse microglia within and adjacent to FTD and Ctrl grafts, postmortem FTD and Ctrl microglia. (L) As in G, but for genes increased in postmortem microglia projected in host murine microglia. Two-sample Kolmogorov-Smirnov test was applied in panels G and L. The p-values are indicated. See also Figure S4.
Figure 7.
Figure 7.. Osteopontin modulates neuronal survival and microglial infiltration around FTD grafts.
(A) RT-qPCR for SPP1, SPARC and C3 in FTD neurons after SPP1 knockdown. (B) Enrichment plot showing depletion of genes that are upregulated in cultured FTD-iPSC-derived neurons (‘iFTD’), in FTDshSPP1 neurons. NES = Normalized Enrichment Score. (C) MTS assay demonstrating rescue of oligomycin-induced cell death in FTDshSPP1 neurons. (D) Seahorse assay on FTDscr and FTDshSPP1 neurons demonstrating reduction of basal OCR in FTDshSPP1 neurons. (E) Quantification of ATP in FTDscr and FTDshSPP1 neurons. (F) Quantification of polar metabolites in FTDscr and FTDshSPP1 neurons. (G) Percentages of selected 13C-labeled and 12C-unlabeled metabolites of the TCA cycle and associated pathways after application of 13C-glutamine to the medium of FTDscr and FTDshSPP1 neurons. (H) ELISA of the medium supernatant of cultured FTDscr and FTDshSPP1 neurons for Osteopontin. (I) Schematic drawing of the experimental approach using FTDscr and FTDshSPP1 neural cells for transplantation. (J) Immunohistochemical stainings of FTDscr and FTDshSPP1 grafts for hNCAM. (K) As in J, but at the graft-host interface. (L) Quantification of hNCAM positivity within grafts. (M) Quantification of hNCAM positivity at the graft-host interface. (N) Immunostainings of FTDscr and FTDshSPP1 grafts for Iba1 and HNA with DAPI counterstaining. (O) Quantification of Iba-1+ microglial cells around FTDscr and FTDshSPP1 grafts. Scale bars: 50μm (K and N) and 100μm (J). *p < 0.05 and **p < 0.01, ***p < 0.001, ****p < 0.0001 - one-tailed Student’s t-test (A,D,E,F,H,L,M,O), Multiple t-test (G) or One-way-ANOVA with Dunnett’s multiple comparisons test (C). Data are presented as mean + SEM. See also Figure S5.

References

    1. Bird T, Knopman D, VanSwieten J, Rosso S, Feldman H, Tanabe H, Graff-Raford N, Geschwind D, Verpillat P, and Hutton M. (2003). Epidemiology and genetics of frontotemporal dementia/Pick’s disease. Ann Neurol 54 Suppl 5, S29–31. 10.1002/ana.10572. - DOI - PubMed
    1. Goedert M, Spillantini MG, Jakes R, Rutherford D, and Crowther RA (1989). Multiple isoforms of human microtubule-associated protein tau: sequences and localization in neurofibrillary tangles of Alzheimer’s disease. Neuron 3, 519–526. 0896–6273(89)90210–9 [pii]. - PubMed
    1. Goedert M, and Jakes R. (1990). Expression of separate isoforms of human tau protein: correlation with the tau pattern in brain and effects on tubulin polymerization. EMBO J 9, 4225–4230. - PMC - PubMed
    1. Ghetti B, Oblak AL, Boeve BF, Johnson KA, Dickerson BC, and Goedert M. (2015). Invited review: Frontotemporal dementia caused by microtubule-associated protein tau gene (MAPT) mutations: a chameleon for neuropathology and neuroimaging. Neuropathol Appl Neurobiol 41, 24–46. 10.1111/nan.12213. - DOI - PMC - PubMed
    1. Goedert M, Ghetti B, and Spillantini MG (2012). Frontotemporal dementia: implications for understanding Alzheimer disease. Cold Spring Harb Perspect Med 2, a006254. 10.1101/cshperspect.a006254 a006254 [pii]. - DOI - PMC - PubMed

Publication types