. 2024 Apr 16;15(1):2863.
doi: 10.1038/s41467-024-46906-4.

Uveal melanoma immunogenomics predict immunotherapy resistance and susceptibility

Affiliations

Uveal melanoma immunogenomics predict immunotherapy resistance and susceptibility

Shravan Leonard-Murali et al. Nat Commun. .

Abstract

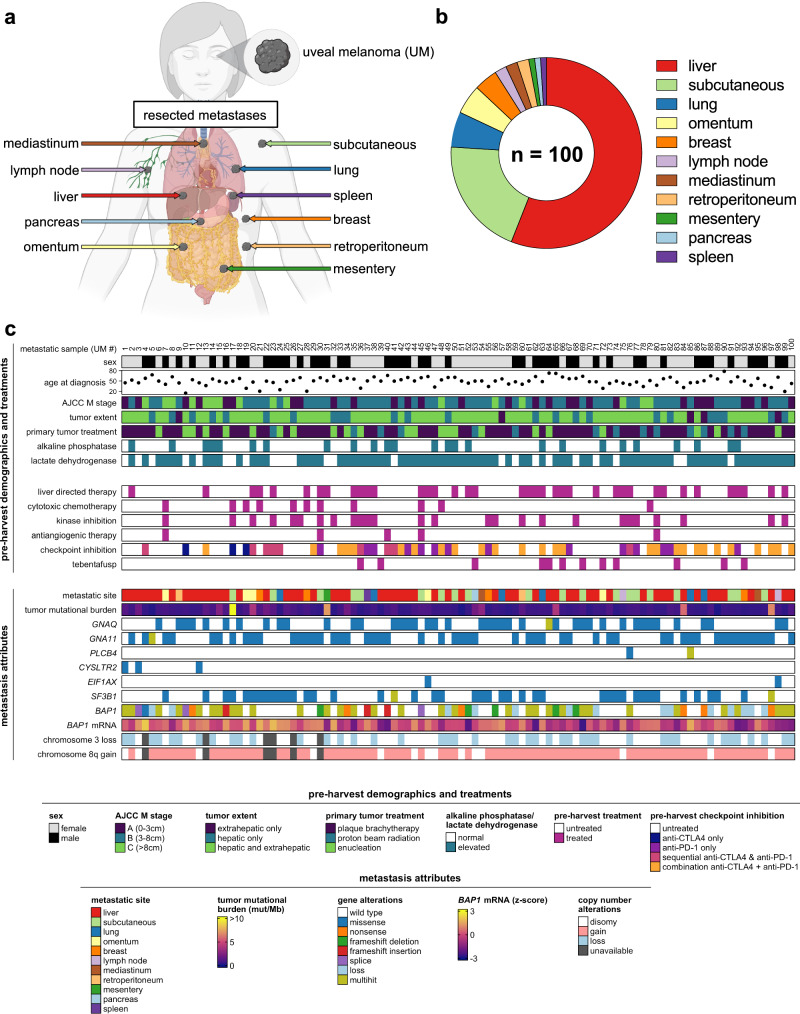
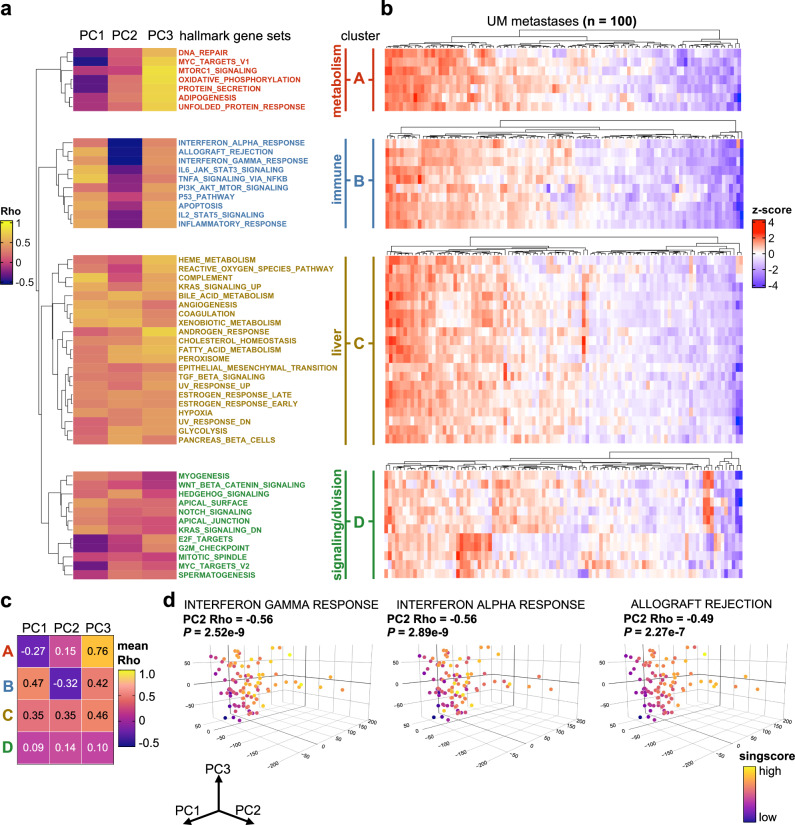
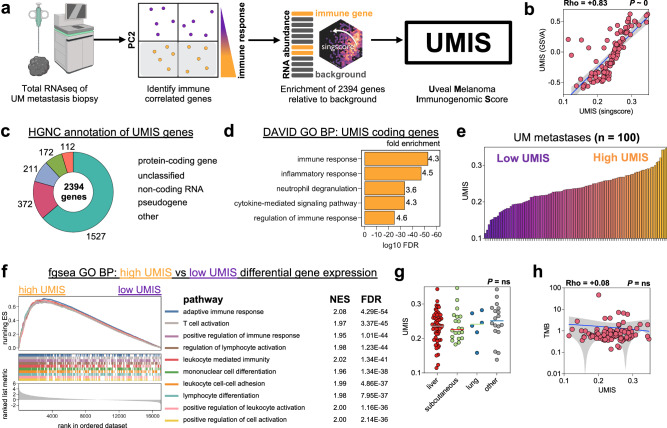
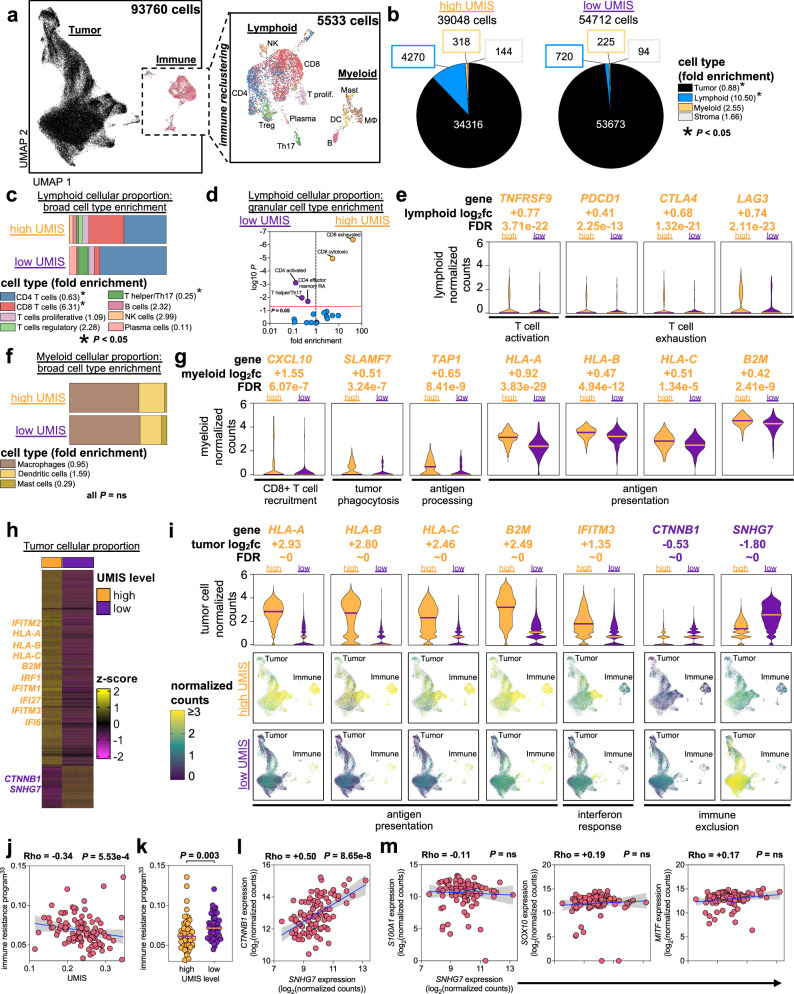
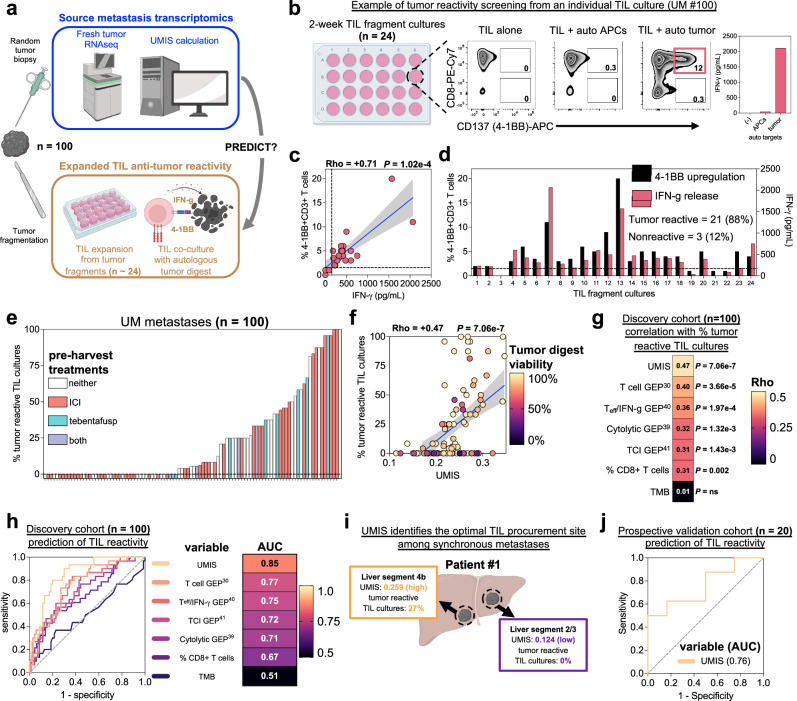
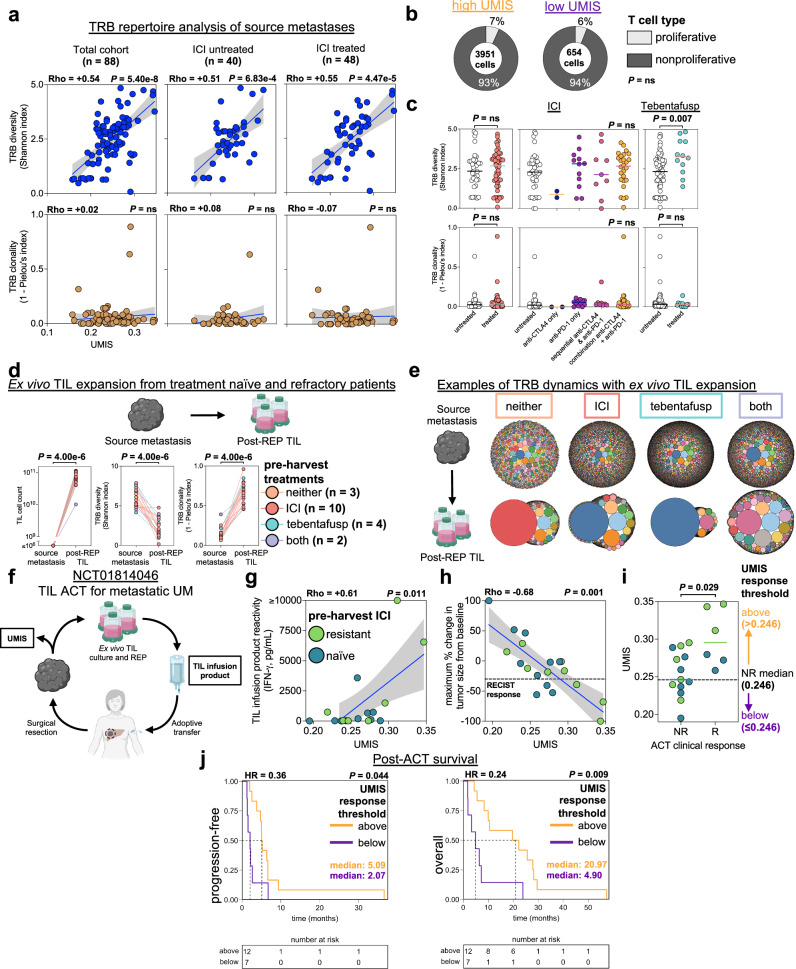
Immune checkpoint inhibition has shown success in treating metastatic cutaneous melanoma but has limited efficacy against metastatic uveal melanoma, a rare variant arising from the immune privileged eye. To better understand this resistance, we comprehensively profile 100 human uveal melanoma metastases using clinicogenomics, transcriptomics, and tumor infiltrating lymphocyte potency assessment. We find that over half of these metastases harbor tumor infiltrating lymphocytes with potent autologous tumor specificity, despite low mutational burden and resistance to prior immunotherapies. However, we observe strikingly low intratumoral T cell receptor clonality within the tumor microenvironment even after prior immunotherapies. To harness these quiescent tumor infiltrating lymphocytes, we develop a transcriptomic biomarker to enable in vivo identification and ex vivo liberation to counter their growth suppression. Finally, we demonstrate that adoptive transfer of these transcriptomically selected tumor infiltrating lymphocytes can promote tumor immunity in patients with metastatic uveal melanoma when other immunotherapies are incapable.


Conflict of interest statement

The authors declare no competing interests.

Figures

Fig. 1
Fig. 1. Clinicogenomic landscape of metastatic uveal melanoma.
a Diversity of source tissues of resected metastases. Created with BioRender.com. b Distribution of source tissues of resected metastases. c Clinicogenomic annotation of individual metastases. Each column represents a single metastasis. BAP1 mRNA z-scores were calculated using log2(normalized counts).
Fig. 2
Fig. 2. Unbiased tumor transcriptomics reveals T cell-inflamed uveal melanoma metastases.
a Unsupervised clustering of Spearman’s rank correlation coefficients derived from correlating PC coordinates (columns) with enrichment of hallmark signatures (row) for each individual metastatic sample (n = 100). Natural clusters identified by the row dendrogram are split, labeled (A, B, C, D), annotated, and color coded for visualization. b Heatmaps illustrating heterogeneity of hallmark signature enrichment across UM metastases (n = 100). Rows correspond to hallmark signatures listed in (a). Columns within each heatmap represent individual metastases. Each heatmap was clustered by metastases separately to display tumor heterogeneity within each hallmark cluster. Z-scores were calculated per row. c Matrix of mean Spearman’s rank correlation coefficients for each cluster-PC combination. d Three-dimensional PCA plots displaying enrichment scores for selective hallmark immune related pathways identified in cluster B. Euclidean distance was used for hierarchical clustering (a, b). Statistical comparisons were performed using Spearman’s rank correlation (ad).
Fig. 3
Fig. 3. Development of Uveal Melanoma Immunogenomic Score (UMIS).
a Workflow for the development of UMIS. Created with BioRender.com. b Correlation of UMIS scores calculated by the cohort-independent method, singscore, with UMIS scores calculated by the cohort-dependent method, gene set variation analysis (GSVA). c Annotation of UMIS genes using Human Genome Organization (HUGO) Gene Nomenclature Committee (HGNC). d Functional annotation of protein-coding genes within UMIS using Database for Annotation, Visualization and Integrated Discovery (DAVID) and Human Molecular Signatures Database Gene Ontology Biological Process gene set collection. e Distribution of UMIS scores across the cohort of 100 metastases. f Gene set enrichment analysis of differentially expressed genes between high UMIS and low UMIS UM metastases. The ten pathways with the lowest FDR are displayed. g Comparison of UMIS by source tissue of resected metastases (n = 100 biologically independent samples; liver = 56, subcutaneous = 20, lung = 6, other = 18). h Correlation of UMIS with TMB. Statistical comparisons were performed using Spearman’s rank correlation with overlaid simple linear regression to illustrate linearity (b, h), DAVID modified Fisher’s exact test (d), fast preranked gene set enrichment analysis (f), or Kruskal–Wallis test by ranks (g).
Fig. 4
Fig. 4. UMIS uncovers in vivo drivers of T cell recruitment and exclusion.
a Uniform manifold approximation and projection (UMAP) plot of all cells analyzed from 6 UM metastases. Magnified panel shows immune subset of cells after reclustering. Cell labeling is with a broad classification. b Proportion of overall cell types within UMIS groups. Fold enrichment refers to proportion ratio (high UMIS/low UMIS). c Proportion of lymphoid broad cell types within UMIS groups. Fold enrichment refers to proportion ratio (high UMIS/low UMIS). d Volcano plot of lymphoid granular cell types within UMIS groups. Fold enrichment refers to proportion ratio (high UMIS/low UMIS). e Selected genes from differential gene expression analysis of high UMIS versus low UMIS lymphoid cells. Bars indicate medians and log2fc refers to log2(fold change). f Proportion of myeloid broad cell types within UMIS groups. Fold enrichment refers to proportion ratio (high UMIS/low UMIS). g Selected genes from differential gene expression analysis of high UMIS versus low UMIS myeloid cells. Bars indicate medians and log2fc refers to log2(fold change). h Heatmap of differentially expressed genes between high UMIS and low UMIS tumor cells. Columns are individual cells, rows are genes. Cells are grouped by the UMIS level of their metastasis. The genes included had log2(fold change) ≥ |0.5| and FDR < 0.05. Z-scores were calculated per row. i Selected genes from differential gene expression analysis of high UMIS versus low UMIS tumor cells. Bars indicate medians and log2fc refers to log2(fold change). UMAP plots display all cells within each UMIS subset. j Correlation of UMIS with immune resistance program scores in UM metastases (n = 100). k Comparison of immune resistance program scores by UMIS level in UM metastases (high UMIS n = 50, low UMIS n = 50; total n = 100 biologically independent samples). l Correlation of SNHG7 with CTNNB1 transcript expression in UM metastases (n = 100). Units are log2(normalized counts) from bulk RNAseq. m Correlation of SNHG7 with canonical melanoma marker transcripts (S100A1, SOX10, MITF) in UM metastases (n = 100). Units are log2(normalized counts) from bulk RNAseq. Statistical comparisons were performed using propeller (arcsin square root transformation of proportions) (bd, f), Wilcoxon rank-sum test (two-tailed) (e, g, i, k) and Spearman’s rank correlation with overlaid simple linear regression to illustrate linearity (j, l, m).
Fig. 5
Fig. 5. UMIS predicts anti-tumor potency of ex vivo expanded TIL.
a Workflow for parallel analysis of source tumor transcriptomics and expanded TIL anti-tumor reactivity. Created with BioRender.com. b Example of TIL culture anti-tumor reactivity screening from source tumor UM #100. From left, tumor fragments (n = 24) are cultured individually for ~2 weeks before overnight coculture with autologous tumor cells and measurement of 4-1BB (CD137) expression by flow cytometry and IFN-γ release by ELISA. Final reactivity measurement subtracts background reactivity of TIL (TIL alone) and non-specific reactivity (TIL + autologous APCs). c Correlation between %4-1BB + CD3+ cells and IFN-γ release among the 24 fragment cultures from UM #100 after overnight tumor coculture. d Individual TIL fragment culture anti-tumor reactivity as assessed by 4-1BB upregulation and IFN-γ release from source tumor UM #100. TIL cultures were classified as tumor reactive if their 4-1BB expression was >1% (dotted line) and twice background or IFN-γ release was >100 pg/ml (dotted line) and twice background. Percentage tumor reactive TIL cultures was defined as 100*(tumor reactive TIL cultures)/(total TIL cultures). e Distribution of percent tumor reactive TIL cultures among the cohort of 100 metastases color-coded by pre-harvest treatments. f Correlation of UMIS with percent tumor reactive TIL cultures. Color of each point denotes tumor digest viability percentage. g Correlative benchmarking of UMIS against published gene expression profiles and tumor biomarkers (n = 100 metastases). All correlations are with percent tumor reactive TIL cultures. h Predictive benchmarking of UMIS against published gene expression profiles and tumor biomarkers (n = 100 metastases). Receiver operating characteristic (ROC) curves and accompanying statistics are for variables’ prediction of ≥33% tumor reactive TIL cultures. i Disparate UMIS and TIL culture reactivity from synchronous hepatic metastases in UM patient #1. Created with BioRender.com. j Validation of UMIS’ ability to predict ex vivo TIL reactivity in an independent metastatic biopsy cohort (n = 20 metastases). Receiver operating characteristic (ROC) curve and area under curve (AUC) value is for UMIS’ prediction of ≥33% tumor reactive TIL cultures. Statistical comparisons were performed using Spearman’s rank correlation with overlaid simple linear regression to illustrate linearity (c, f, g) or univariate logistic regression (h, j). Gene expression profiles were calculated using singscore to best assess their cohort-independent predictive ability (Supplementary Data 16),–.
Fig. 6
Fig. 6. UMIS identifies quiescent TIL resistant to ICI and tebentafusp but sensitive to ex vivo expansion and adoptive transfer.
a T cell receptor beta (TRB) repertoire analysis of bulk RNAseq of UM metastases (n = 88). Immune checkpoint inhibition (ICI) refers to treatment history prior to metastatic biopsy. b Proportion of proliferative T cells in UMIS groups by single cell atlas. c Comparisons of TRB diversity and clonality in ICI or tebentafusp untreated versus treated metastases (ICI: 48 treated, 40 untreated; tebentafusp: 12 treated, 76 untreated). d Ex vivo TIL expansion from treatment naïve and refractory patients (n = 19). Listed therapies were received prior to metastatic biopsy. Changes in TIL cell counts (left), T cell receptor beta (TRB) diversity (middle), and TRB clonality (right) are shown for source metastases and corresponding TIL cultures post rapid expansion protocol (post-REP TIL). Metastases’ TIL counts were conservatively estimated to be ≤106. TRB repertoires were characterized with targeted TCR repertoire analysis. Schematic created with BioRender.com. e Examples of TRB dynamics with ex vivo TIL expansion. Bubble plots represent unique TRB clonotypes (color coded) with bubble size indicating percentage of total clonotypes. Shown are representative examples for each pre-harvest treatment group (neither = UM #73, ICI = UM #50, tebentafusp = UM #59, both = UM #49). Schematic created with BioRender.com. f Schematic for evaluation of UMIS in the context of NCT01814046 (ACT of TIL for metastatic UM). Created with BioRender.com. g Correlation of source metastasis UMIS with TIL infusion product reactivity (n = 17). h Correlation of source metastasis UMIS with maximum percent change in tumor size from baseline (RECIST v1.1) after TIL ACT. RECIST response line is drawn at −30% (n = 19). i Comparison of UMIS between responders (R; n = 6) and nonresponders (NR; n = 13) to TIL ACT. The median UMIS of the NR group (0.246) was used as a clinical response threshold for outcome analyses. j Time-to-event curves of post-ACT survivals by UMIS response thresholds (n = 19). Progression-free survival used progressive disease as the event (median follow-up (months): high = 5.09, low = 2.07). Overall survival used death as the event (median follow-up (months): high = 20.97, low = 4.90). Hazard ratios (HR) are for above versus below threshold groups. Statistical comparisons were performed using Spearman’s rank correlation with overlaid simple linear regression to illustrate linearity (a, g, h), Fishers exact test (b), Wilcoxon rank-sum test (two-tailed) (c, i), Kruskal–Wallis test by ranks (c), Wilcoxon signed-rank test (two-tailed) (d) or logrank test (j).

References

    1. Hodi FS, et al. Improved survival with ipilimumab in patients with metastatic melanoma. N. Engl. J. Med. 2010;363:711–723. doi: 10.1056/NEJMoa1003466. - DOI - PMC - PubMed
    1. Larkin J, et al. Five-year survival with combined nivolumab and ipilimumab in advanced melanoma. N. Engl. J. Med. 2019;381:1535–1546. doi: 10.1056/NEJMoa1910836. - DOI - PubMed
    1. Samstein RM, et al. Tumor mutational load predicts survival after immunotherapy across multiple cancer types. Nat. Genet. 2019;51:202–206. doi: 10.1038/s41588-018-0312-8. - DOI - PMC - PubMed
    1. Yarchoan M, Hopkins A, Jaffee EM. Tumor mutational burden and response rate to PD-1 inhibition. N. Engl. J. Med. 2017;377:2500–2501. doi: 10.1056/NEJMc1713444. - DOI - PMC - PubMed
    1. Tawbi HA, et al. Relatlimab and nivolumab versus nivolumab in untreated advanced melanoma. N. Engl. J. Med. 2022;386:24–34. doi: 10.1056/NEJMoa2109970. - DOI - PMC - PubMed

LinkOut - more resources