. 2024 Apr 16;15(1):3270.
doi: 10.1038/s41467-024-47217-4.

Differentiation shifts from a reversible to an irreversible heterochromatin state at the DM1 locus

Affiliations

Differentiation shifts from a reversible to an irreversible heterochromatin state at the DM1 locus

Tayma Handal et al. Nat Commun. .

Abstract

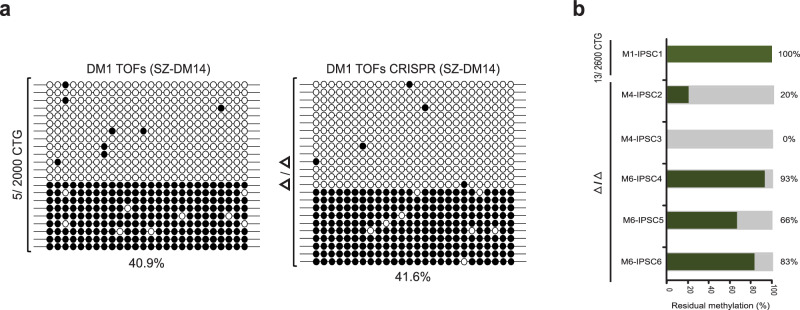
Epigenetic defects caused by hereditary or de novo mutations are implicated in various human diseases. It remains uncertain whether correcting the underlying mutation can reverse these defects in patient cells. Here we show by the analysis of myotonic dystrophy type 1 (DM1)-related locus that in mutant human embryonic stem cells (hESCs), DNA methylation and H3K9me3 enrichments are completely abolished by repeat excision (CTG2000 expansion), whereas in patient myoblasts (CTG2600 expansion), repeat deletion fails to do so. This distinction between undifferentiated and differentiated cells arises during cell differentiation, and can be reversed by reprogramming of gene-edited myoblasts. We demonstrate that abnormal methylation in DM1 is distinctively maintained in the undifferentiated state by the activity of the de novo DNMTs (DNMT3b in tandem with DNMT3a). Overall, the findings highlight a crucial difference in heterochromatin maintenance between undifferentiated (sequence-dependent) and differentiated (sequence-independent) cells, thus underscoring the role of differentiation as a locking mechanism for repressive epigenetic modifications at the DM1 locus.


Conflict of interest statement

The authors declare no competing interests.

Figures

Fig. 1
Fig. 1. Reversal of abnormal methylation and loss of repressive histone modifications by CTG repeat excision in mutant hESCs.
a Colony DNA bisulfite sequencing of the DMR (488-777 bp upstream of the repeat, 26 CpG sites) in unmanipulated DM1 hESCs with a heavily methylated CTG2000 expansion (SZ-DM14, methylation levels of 55%), a pair of gene-edited CTG-deficient (Δ/Δ) clones (CL9 and CL29, methylation levels of 0%) and two CRISPRed clones still bearing 1300 CTGs (55%, CL7) and 700 and fewer CTGs (17%, CL13), and wild type hESCs with 5/11 CTG alleles (SZ-RB26, methylation levels of 0%) before and after (Δ/Δ) repeat excision. Filled circles: methylated CpGs; empty circles: unmethylated CpGs. b Real-time PCR ChIP analysis for H3K9me3 in wild type (SZ-13), parental DM1 affected hESC line (SZ-DM14, CTG2000), and isogenic CTG-deficient homozygote clones (CL9 and CL29). APRT and HOXA9 were used as negative and positive controls, respectively. Negative controls were set to one. The data is derived from either n = 3 (SZ-DM14, CL9, and CL29) or n = 4 (wild type) independent ChIP experiments. Each panel illustrates the average ± standard deviation (STD) calculated across all technical replicates. Statistically significant enrichments were calculated within each cell line for DMPK and HOXA9 by comparing to APRT, and between cell lines for DMPK by pairwise comparison to DM1-affected hESC line (two-sided paired t-test). c Real-time PCR ChIP analysis for H3K27me3 in wild type (SZ-13), parental DM1 affected hESC line (SZ-DM14, CTG2000), and isogenic CTG-deficient homozygote clones (CL9 and CL29). APRT and HOXA9 were used as negative and positive controls, respectively. Negative controls were set to one. The data is derived from n = 3 independent ChIP experiments. Each panel illustrates the average ± standard deviation (STD) calculated across all technical replicates. Statistically significant enrichments were calculated within each cell line for DMPK and HOXA9 by comparing to APRT by pairwise comparison to DM1-affected hESC line (two-sided paired t-test). P-values: ns = p > 0.05 *p < 0.05, **p < 0.01, ***p < 0.001, ****p < 0.0001. Precise P-values are provided in Table S4. Source data are provided as a Source data file.
Fig. 2
Fig. 2. CTG excision in affected myoblasts does not restore the normal epigenetic status of the DM1 locus.
a Allele-specific colony DNA bisulfite sequencing at the disease-related DMR (488-777 bp upstream of the repeat, 26 CpG sites) pre and post repeat excision (after >20 population cell doublings) from affected myoblasts with normal and expanded alleles (13/2600 CTG), three completely CTG-deficient (Δ/Δ), one heterozygote for the deletion against the mutant allele (13/Δ), three unsuccessfully manipulated clones (13/2600 CTG), and an independent control myoblast cell line (5/14 CTG). Methylation patterns shown for manipulated clones (Δ/Δ, 13/Δ, and 13/2600) on variant T background. Filled circles: methylated CpGs; empty circles: unmethylated CpGs. b ChIP analysis for H3K9me3 in successfully edited (Δ/Δ, clones M4 and M6) versus unsuccessfully edited (13/2600 CTG, clones M1 and M3) DM1 myoblast clones. APRT and MYOGENIN as controls. Data: derived from n = 3 (M4) or n = 4 (M6, M1 and M3) independent ChIP experiments. Each panel illustrates the average ± standard deviation (STD) calculated across all technical replicates. Statistically significant enrichments calculated within each cell line for DMPK and MYOGENIN compared to APRT (two-sided paired t-test). c ChIP analysis for H3K27me3 in successfully edited (Δ/Δ, clones M4 and M6) versus unsuccessfully edited (13/2600 CTG, clones M1 and M3) DM1 myoblasts. APRT as negative control, set to one. Data: derived from n = 2 (M6), n = 3 (M4 and M3) or n = 5 (M1) independent ChIP experiments. Each panel illustrates the average ± standard deviation (STD) calculated across all technical replicates. Statistically significant enrichments calculated within each cell line for DMPK compared to APRT (two-sided paired t-test). P-values: *p < 0.05, **p < 0.01, ***p < 0.001, ****p < 0.0001. Precise P-values are provided in Table S4. Source data are provided as a Source data file.
Fig. 3
Fig. 3. The shift from a reversible to an irreversible heterochromatin state by hESC differentiation that can be set back by reprogramming after repeat removal.
a Colony DNA bisulfite sequencing of the DMR (26 CpG sites) in unmanipulated DM1 affected teratoma-derived cell cultures with a heavily methylated CTG2000 expansion (SZ-DM14 TOFs) before (DM1 Δ/Δ TOFs, 40.9%), and after (DM1 Δ/Δ TOFs CRISPR, 41.6%) repeat excision. Filled circles: methylated CpGs; empty circles: unmethylated CpGs. b A graph summarizing the aberrant methylation levels in iPSCs derived from successfully targeted (M4-IPSC2/3 and M6-IPSC4/5/6, Δ/Δ) and unsuccessfully edited (M1-IPSC1, 13/2600CTG) DM1 affected myoblast clones. Methylation levels at the DMR, against the background of the mutant allele (variant T) were determined by colony DNA bisulfite sequencing (also shown in Fig. S6b), ranging from 0% to 93% in the resulting Δ/Δ iPSCs.
Fig. 4
Fig. 4. Abnormal methylation at the DM1 locus is maintained by de novo DNMTs activity in hESCs.
a Volcano plots comparing chromatin modifier gene expression between undifferentiated DM1 hESCs and their in vivo differentiated counterparts: teratoma-derived fibroblasts (left) or patient myoblasts (right). Red denotes high expression in undifferentiated hESCs, blue in the alternative cell type (TOFs/myoblasts), and gray for equal expression. Green denotes the levels of three pluripotent-associated markers in undifferentiated hESCs. Each data set averages 3 technical experiments. Volcano plot analysis employed edgeR for RNA-seq analysis, with subsequent FDR correction for multiple testing. Plots were generated using the VolcanoNose R program. b DNMT3b targeting approach overview. Bottom: Western blot assesses DNMT3b protein levels in parental DM1-affected hESC line (CTRL) and genetically manipulated isogenic clones, with GAPDH as loading control. The experiment was conducted once. c Residual methylation levels (%) at the DM1-related DMR in single knockouts (SKO) of DNMT3b DM1 hESC clones determined via locus-specific bisulfite DNA deep-sequencing. Levels are relative to baseline in parental hESCs (SZ-DM14), set at 50%. d DNMT3a targeting approach overview. Bottom: DNMT3a mRNA levels assessed before and after gene editing in DNMT3-null DM1-affected hESCs. Residual DNMT3a transcripts post-editing examined by RT-qPCR (exon 17–18, left), and exon 19 skipping validation by RT-PCR (right). CTRL DM1-affected hESCs and M1 myoblasts (myob) served as positive and negative controls, respectively. Data per clone averages n = 4 (I3), n = 5 (3G) or n = 6 (I4, 3K, 3C) technical experiments. Error bars: standard deviation. Significant DNMT3a transcription changes assessed via pairwise comparison (two-sided paired t-test). P-values: ***p < 0.001, ****p < 0.0001. Precise P-values are provided in Table S4. e Residual methylation levels (%) in DM1-related DMR of double-targeted DNMT3a and DNMT3b DM1 hESC clones (DKO) determined via locus-specific bisulfite DNA deep-sequencing. Levels are relative to parental hESCs (SZ-DM14), set at 50%. Source data are provided as a Source data file.
Fig. 5
Fig. 5. A model for the shift from reversible to irreversible aberrant methylation in DM1 by cell differentiation.
Top panel: In DM1 undifferentiated embryonic cells (hESCs), every DNA replication cycle aberrant methylation is repeatedly erased by TET1, and then re-established by de novo DNMTs activity (initiation step) in a way that depends on the presence of the mutation. Once the cells differentiate (skeletal muscle), aberrant methylation patterns remain unchanged by the activity of maintenance DNMTs (“locking up” step), independent of the DNA sequence. Bottom panel: When the CTG expansion is excised from a heavily methylated allele with a large CTG expansion, it results in the loss of aberrant methylation in undifferentiated cells (reversible). This contrasts with the differentiated cells, where excision of the CTGs did not change the epigenetic status of the locus (irreversible). Black lollipops correspond to methylated CpGs and white lollipops represent unmethylated CpGs.

References

    1. Li E, Zhang Y. DNA methylation in mammals. Cold Spring Harb. Perspect. Biol. 2014;6:a019133. doi: 10.1101/cshperspect.a019133. - DOI - PMC - PubMed
    1. Cedar H, Bergman Y. Programming of DNA methylation patterns. Annu Rev. Biochem. 2012;81:97–117. doi: 10.1146/annurev-biochem-052610-091920. - DOI - PubMed
    1. Moore LD, Le T, Fan G. DNA methylation and its basic function. Neuropsychopharmacology. 2013;38:23–38. doi: 10.1038/npp.2012.112. - DOI - PMC - PubMed
    1. Zoghbi HY, Beaudet AL. Epigenetics and human disease. Cold Spring Harb. Perspect. Biol. 2016;8:a019497. doi: 10.1101/cshperspect.a019497. - DOI - PMC - PubMed
    1. Park CY, et al. Reversion of FMR1 methylation and silencing by editing the triplet repeats in fragile X iPSC-derived neurons. Cell Rep. 2015;13:234–241. doi: 10.1016/j.celrep.2015.08.084. - DOI - PubMed

Substances