Clinical Trial
. 2024 Apr 16;15(1):3260.
doi: 10.1038/s41467-024-47420-3.

Neoadjuvant tislelizumab plus stereotactic body radiotherapy and adjuvant tislelizumab in early-stage resectable hepatocellular carcinoma: the Notable-HCC phase 1b trial

Affiliations
Clinical Trial

Neoadjuvant tislelizumab plus stereotactic body radiotherapy and adjuvant tislelizumab in early-stage resectable hepatocellular carcinoma: the Notable-HCC phase 1b trial

Zhongchao Li et al. Nat Commun. .

Abstract

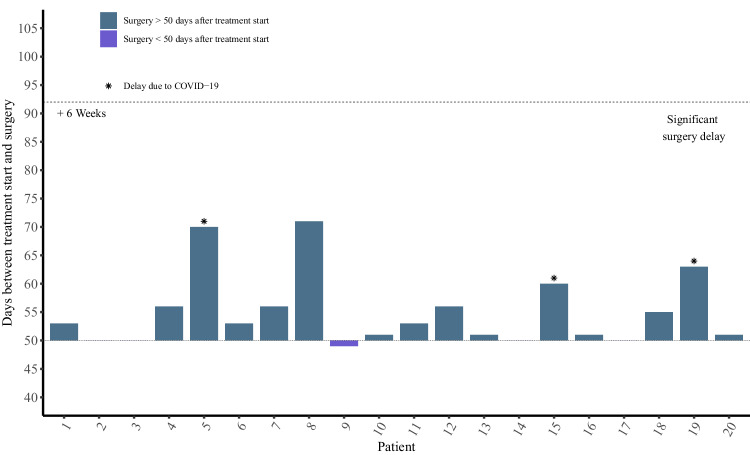
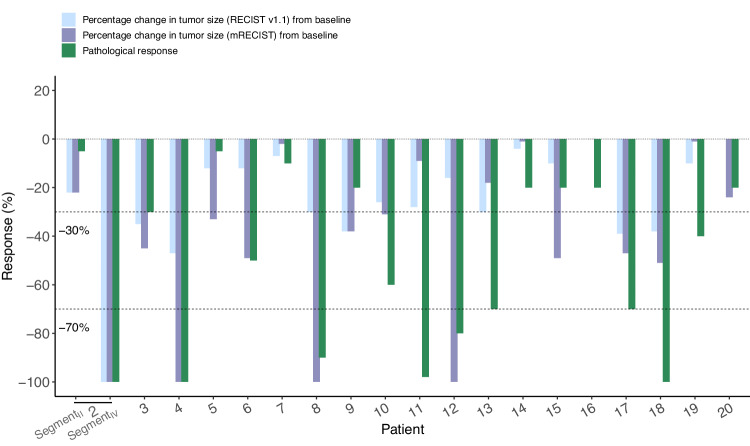
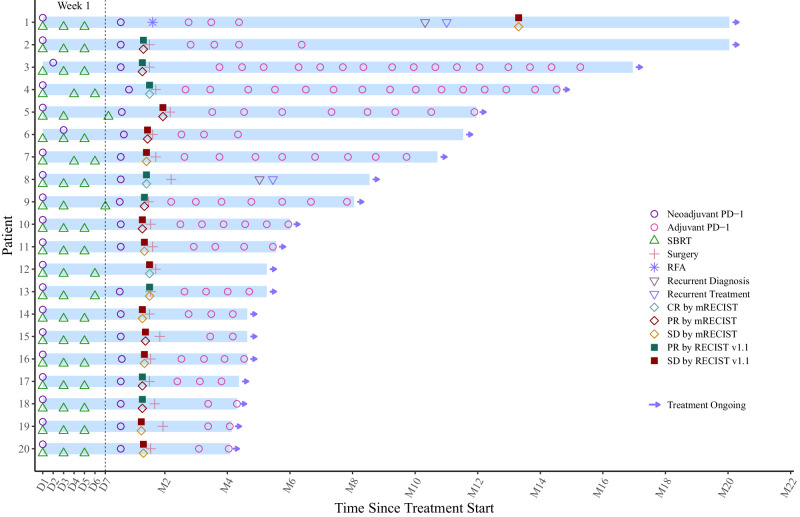
Notable-HCC (NCT05185531) is a phase 1b trial, aiming to evaluate the safety and preliminary effectiveness of neoadjuvant PD-1 blockade plus stereotactic body radiotherapy (SBRT) in early-stage resectable hepatocellular carcinoma (HCC). Twenty patients with HCC of BCLC stage 0-A received 3 × Gy SBRT and two cycles of tislelizumab, an anti-PD-1 monoclonal antibody before the curative HCC resection. Primary endpoints were the surgery delay, radiographic and pathological tumor response after the neoadjuvant therapy, safety and tolerability. During the neoadjuvant therapy, treatment-related adverse events (TRAEs) of grade 1-2 occurred in all 20 patients (100%), eight patients (40%) had grade 3 TRAEs, no grade 4 to 5 TRAE occurred, and all resolved without corticosteroids treatment. Per mRECIST, the objective response rate was 63.2% (12/19), with 3 complete response; the disease control rate was 100%. Two (10.5%) patients achieved complete pathological response. No surgery delay occurred. The neoadjuvant therapy did not increase the surgical difficulty or the incidence of complications. Secondary endpoints of disease-free survival and overall survival were not mature at the time of the analysis. Our pilot trial shows that neoadjuvant therapy with anti-PD-1 + SBRT is safe and promotes tumor responses in early-stage resectable HCC.


Conflict of interest statement

L.Z. is on the speakers’ bureau for Bayer, MSD, AstraZeneca, Roche, BeiGene, Innovent, Junshi Biosciences, and Hengrui Medicine. The remaining authors declare no competing interests.

Figures

Fig. 1
Fig. 1
Days between treatment initiation and surgery (n = 20). Each bar represents one patient in safety analysis set. Source data are provided as a Source Data file.
Fig. 2
Fig. 2
Radiographic and pathological responses to neoadjuvant SBRT and tislelizumab in efficacy analysis set (n = 19). Waterfall plots of the proportion of patients with an overall response by RECIST v1.1 and mRECIST before surgery, and major pathological responses on resected tumors. Source data are provided as a Source Data file.
Fig. 3
Fig. 3. The swimmer plot presents the treatment duration for patients who received neoadjuvant therapy, and subsequent adjuvant therapy after surgery.
Each bar represents one patient in the study (n = 19). Source data are provided as a Source Data file.
Fig. 4
Fig. 4. Immune infiltration differential analysis of bulk RNA sequencing data between pre- and post-neoadjuvant therapy of tislelizumab plus SBRT in HCC patients (n = 19).
Blue represents patients at pre-neoadjuvant therapy (n = 19), and red represents patients at post-neoadjuvant therapy (n = 19). Points represent the enrichment scores estimated by ssGSEA for immune cells in each patient. Boxplot with error bar shows the distribution of enrichment scores of patients at pre-neoadjuvant therapy and post-neoadjuvant therapy for each immune cell type. Within each box, the horizontal line and box indicate the median and 25th/75th percentile, respectively. The white dot represents the mean, and error bar represents the mean ± standard deviation. The two-sided p values are performed by the Wilcoxon rank-sum test, and exact p value <0.05 are labeled above each comparison. Source data are provided as a Source Data file.
Fig. 5
Fig. 5. Expression differences of T-cell activation-related genes between pre- and post-neoadjuvant therapy.
a Heatmap representation of T cell activates related genes expression in patients at pre- and post-neoadjuvant therapy; b comparison of immune scores of T cell activates related genes between pre- and post-neoadjuvant therapy (n = 19); c Comparison of immune scores of T cell activates related genes across mRECIST response categories. The mRECIST categories were defined as SD (Stable Disease) (n = 7), PR (Partial Response) (n = 9), and CR (complete response) (n = 3); CLD represents the assessment of the change in the longest diameter according to mRECIST criteria. Patient bar labeled by patient ID. The heatmap illustrates the scaled values derived from the gene expression data, ranging from blue to red, indicating increasing values. Blue represents patients in pre-neoadjuvant therapy, and red represents patients at post-neoadjuvant therapy. Boxplot accompanied with jittered points illustrates the distribution of log2 transformed immune scores for each patient. Within the box, horizontal line represents the median, and box represents 25th and 75th percentile. Whiskers are calculated with the formula median ± 1.5 × interquartile range. Paired t tests are conducted between pre- and post-treatment data, whereas pairwise comparisons across different mRECIST categories are assessed using the Wilcoxon rank-sum method. Exact two-sided p-values, with significance levels (p value < 0.05), are provided above the respective comparisons. Source data are provided as a Source Data file.
Fig. 6
Fig. 6. Heatmap representation of published immune cells gene signatures expression at pre- and post-treatment (n = 19).
The mRECIST categories were defined as SD (Stable Disease), PR (Partial Response), and CR (Complete Response); CLD represents the assessment of the change in the longest diameter according to mRECIST criteria. Patient bar labeled by patient ID. The heatmap illustrates the scaled values derived from the gene expression data, ranging from blue to red, indicating increasing values. Blue represents patients at pre-treatment, and red represents patients at post-treatment. Source data are provided as a Source Data file.
Fig. 7
Fig. 7. Immune scores of published immune cells gene signatures.
Comparison of immune scores of published immune cells gene signatures between pre- and post-neoadjuvant therapy (a) (n = 19) and across mRECIST response categories (b) SD (n = 7): stable disease, PR (n = 9): partial response, and CR (n = 3): complete response; blue represents patients at pre-neoadjuvant therapy and red represents patients at post-neoadjuvant therapy. Points show the log2 transformed immune scores for each patient. Boxplot accompanied with jittered points illustrates the distribution of log2 transformed immune scores for each patient. Within the box, horizontal line represents median, and box represents 25th and 75th percentile. Whiskers are calculated with the formula median ± 1.5 × interquartile range. Paired t-tests are conducted between pre- and post-treatment data, whereas pairwise comparisons across different mRECIST categories are assessed using the Wilcoxon rank-sum method. Exact two-sided p values, with significance levels (p value < 0.05), are provided above the respective comparisons. Source data are provided as a Source Data file.
Fig. 8
Fig. 8. HLA genes expression changes post-neoadjuvant therapy.
a Heatmap representation of HLA genes expression in patients at pre- and post-neoadjuvant therapy; b comparison of immune scores of HLA genes between pre- and post-neoadjuvant therapy (n = 19); c comparison of immune scores of HLA genes across mRECIST response categories. The mRECIST categories were defined as SD (stable disease) (n = 7), PR (partial response) (n = 9), and CR (complete response) (n = 3); CLD represents the assessment of the change in the longest diameter according to mRECIST criteria. Patient bar labeled by patient ID. The heatmap illustrates the scaled values derived from the gene expression data, ranging from blue to red, indicating increasing values. Blue represents patients at pre-treatment, and red represents patients at post-treatment. Points show the log2 transformed immune scores for each patient. Boxplot accompanied with jittered points illustrates the distribution of log2 transformed immune scores for each patient. Within the box, horizontal line represents median, and box represents 25th and 75th percentile. Whiskers are calculated with the formula median ± 1.5 × interquartile range. Paired t-tests are conducted between pre- and post-treatment data, whereas pairwise comparisons across different mRECIST categories are assessed using the Wilcoxon rank-sum method. Exact two-sided p-values, with significance levels (p value < 0.05), are provided above the respective comparisons. Source data are provided as a Source Data file.
Fig. 9
Fig. 9. TCR clonetypes changes post-neoadjuvant therapy (n = 8).
Number (a) and frequency (b) between newly generated and overlapping CDR3 (aa) clonotypes “Newly” represents newly generated clonotypes after treatment, and “overlap” represents overlapping clonotypes present in both pre- and post-neoadjuvant therapy. Hyperexpanded: clonotypes with frequency >1%; Large: clonotypes with frequency ranging from 0.01% to 1%; Small: clonotypes with frequency from 0.001% to 0.01%; Rare: clonotypes with frequency <0.001%. Source data are provided as a Source Data file.

References

    1. Sung H, et al. Global cancer statistics 2020: GLOBOCAN estimates of incidence and mortality worldwide for 36 cancers in 185 countries. CA Cancer J. Clin. 2021;71:209–249. doi: 10.3322/caac.21660. - DOI - PubMed
    1. Qi J, et al. National and subnational trends in cancer burden in China, 2005-20: an analysis of national mortality surveillance data. Lancet Public Health. 2023;8:e943–e955. doi: 10.1016/S2468-2667(23)00211-6. - DOI - PubMed
    1. Villanueva A. Hepatocellular carcinoma. N. Engl. J. Med. 2019;380:1450–1462. doi: 10.1056/NEJMra1713263. - DOI - PubMed
    1. Zhang B, et al. Real-world practice of conversion surgery for unresectable hepatocellular carcinoma - a single center data of 26 consecutive patients. BMC Cancer. 2023;23:465. doi: 10.1186/s12885-023-10955-7. - DOI - PMC - PubMed
    1. Roayaie S, et al. Resection of hepatocellular cancer ≤2 cm: results from two Western centers. Hepatology. 2013;57:1426–1435. doi: 10.1002/hep.25832. - DOI - PMC - PubMed

Publication types

MeSH terms