. 2024 Apr 16;15(1):3259.
doi: 10.1038/s41467-024-47693-8.

Exposing the molecular heterogeneity of glycosylated biotherapeutics

Affiliations

Exposing the molecular heterogeneity of glycosylated biotherapeutics

Luis F Schachner et al. Nat Commun. .

Abstract

The heterogeneity inherent in today's biotherapeutics, especially as a result of heavy glycosylation, can affect a molecule's safety and efficacy. Characterizing this heterogeneity is crucial for drug development and quality assessment, but existing methods are limited in their ability to analyze intact glycoproteins or other heterogeneous biotherapeutics. Here, we present an approach to the molecular assessment of biotherapeutics that uses proton-transfer charge-reduction with gas-phase fractionation to analyze intact heterogeneous and/or glycosylated proteins by mass spectrometry. The method provides a detailed landscape of the intact molecular weights present in biotherapeutic protein preparations in a single experiment. For glycoproteins in particular, the method may offer insights into glycan composition when coupled with a suitable bioinformatic strategy. We tested the approach on various biotherapeutic molecules, including Fc-fusion, VHH-fusion, and peptide-bound MHC class II complexes to demonstrate efficacy in measuring the proteoform-level diversity of biotherapeutics. Notably, we inferred the glycoform distribution for hundreds of molecular weights for the eight-times glycosylated fusion drug IL22-Fc, enabling correlations between glycoform sub-populations and the drug's pharmacological properties. Our method is broadly applicable and provides a powerful tool to assess the molecular heterogeneity of emerging biotherapeutics.


Conflict of interest statement

L.S., W.P., M.I.B., T.B., P.D., C.T., S.S., T.B., D.D., J.G., A.E., N.A., M.M. and W.S. are employed by Genentech, Inc., a for-profit company that produces and markets therapeutics. C.M., J.H., J.E.P.S., R.M. and R.H. are employed by Thermo Fisher Scientific, a for-profit company that manufactures and sells mass spectrometry equipment. The remaining authors declare no competing interests.

Figures

Fig. 1
Fig. 1. DIA-PTCR workflow using ligand hexamer.
a Schematic of the ligand hexamer biotherapeutic with six glycosylation sites. b The glycoprotein is buffer-exchanged into ammonium acetate solution. c The protein is ionized by static nano electrospray (ESI) and introduced into the mass spectrometer. d Full scan MS1 is first acquired to establish the m/z range of the analyte’s ion signal. e Depiction of gas-phase fractionation, showing the mass spectrum of an isolated narrow m/z window containing only a subpopulation of the ions initially present in the MS1 spectrum. f Proton transfer charge reduction on MS2 isolation range (from e), producing a spectrum with resolved m/z peaks corresponding to consecutive charge states of individual glycoforms. g Full stacked spectral representation of PTCR MS2 spectra obtained by the DIA-PTCR method stepping the precursor m/z isolation window center through the entire m/z range of the biotherapeutic ions as detected in the MS1 spectrum. h Neutral mass spectra obtained by mass deconvolution of each isolated PTCR MS/MS spectrum. i Composite mass deconvolution result after ‘spectral stitching’ of all m/z-to-mass deconvolved PTCR MS/MS spectra in the full DIA dataset using UniDec, with annotations elucidated in Supplementary Fig. 3.
Fig. 2
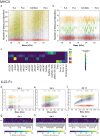
Fig. 2. DIA-PTCR on Major Histocompatibility Complex Class II shows truncated chain.
a Native m/z spectrum (MS1) of Major Histocompatibility Complex Class II DPA1*02:02/DPB1*05:01 allele, with inset showing schematic of MHCII heterodimer, with a human class II-associated invariant chain peptide (hCLIP), a Leucine zipper that promotes heterodimerization, and four glycosylation sites. Note that there is a non-native glycosylation site on the P2A peptide. b Entire dataset PTCR-MS2 spectra (stacked representation) from the DIA-PTCR analysis of the MHCII. c Entire dataset of PTCR-MS2 spectra after mass deconvolution (stacked representation) from the DIA-PTCR analysis of the MHCII. d Heatmap representation of entire set of mass deconvolved PTCR-MS2 (neutral) mass spectra, revealing two glycosylated populations corresponding to MHCII with truncated or full-length Alpha chain, with their respective schematic structures shown as insets.
Fig. 3
Fig. 3. Glycoform heterogeneity of an Fc fusion protein is resolved by DIA-PTCR.
a Native full-scan MS of IL22-Fc, with inset showing structure and eight potential glycosylation sites of the biotherapeutic. The specific glycoform shown, with only seven sites occupied, is elucidated in Supplementary Fig. 15. b Overlaid mass spectra following DIA-PTCR. c Overlaid deconvolution results of the mass spectra in (b). d Glycoform mass distributions for IL22-Fc samples enriched for 4, 8 and 15 mol/mol sialic acid content.
Fig. 4
Fig. 4. Profiling glycosylation on glyvosylated biotherapeutics using orthogonal datasets.
a Glycoform-resolved monosaccharide fingerprint of MHCII using DIA-PTCR data only, showing number of monosaccharides per intact glycoform mass, with glycoform probability encoded by the transparency of the color. b Glycoform-resolved monosaccharide fingerprint of MHCII using integrated DIA-PTCR and glycopeptide data, showing number of monosaccharides per intact glycoform mass, with glycoform relative abundance encoded by the transparency of the color. c Glycan barcode for MHCII based on N- and O- glycan structures determined by glycopeptide analysis, using quantitative input from the integrated approach. The barcode denotes the normalized relative abundance of a glycan assignment per site, color coded according to schematic in (a). On the barcode, the first site corresponds to the non-native site on P2A and the fourth site denotes an O-linked glycosylation site. df Glycoform-resolved monosaccharide fingerprints for IL22-Fc at SA 4, 8 and 15, upon integration with glycoproteomic data, showing number of monosaccharides per intact glycoform mass, with glycoform abundance encoded by the transparency of the color (Supplementary Figs. 12, 14). gi Glycan barcodes for IL22-Fc SA 4, 8 and 15 reflecting the normalized relative abundance of a glycan assignment per site (Supplementary Fig. 16).
Fig. 5
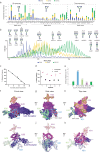
Fig. 5. The sialic acid states and structures of IL22-Fc.
a Comparison of glycan structures and their relative abundance detected in IL22-Fc SA4 (blue), 8 (yellow) and 15 (red) samples. b Glycoform mass distributions for IL22-Fc samples enriched for 4, 8 and 15 mol/mol sialic acid content, with annotations denoting the name and structure of representative glycans comprising abundant IL22-Fc glycoforms. c Relative potency of IL22-Fc measured as a function of sialic acid content. d Percent of relative binding of control or enzymatically desialylated IL22-Fc to its receptor, IL22R1A, as measured in duplicate by ELISA. e Relative potency of IL22-Fc point mutants and wild-type (WT) at each glycosylation site measured in duplicate. fk Structure of glycosylated IL22 bound to its receptor (PDB: 3DLQ) visualized from multiple perspectives in ribbon and surface representations, showing the location of the IL22 glycosylation sites (N21, N35 and N64) and some steric clashes between large representative glycans (A4S4) and the IL22 receptor as a result of their proximity to the cytokine-receptor interface. A structural model in augmented reality is available in Supplementary Fig. 17.

References

    1. Rathore, A. S. & Winkle, H. Quality by design for biopharmaceuticals. Nat. Biotechnol.27, 26–34 (2009). - PubMed
    1. Walsh, G. Biopharmaceutical benchmarks 2018. Nat. Biotechnol.36, 1136–1145 (2018). - PubMed
    1. Zhang, P. et al. Challenges of glycosylation analysis and control: an integrated approach to producing optimal and consistent therapeutic drugs. Drug Discov. Today21, 740–765 (2016). - PubMed
    1. Yehuda, S. & Padler-Karavani, V. Glycosylated Biotherapeutics: Immunological Effects of N-Glycolylneuraminic Acid. Front Immunol.11, 21 (2020). - PMC - PubMed
    1. Silsirivanit, A. Chapter Five Glycosylation markers in cancer. Adv. Clin. Chem.89, 189–213 (2019). - PubMed

MeSH terms