. 2024 Jun;4(6):814-838.
doi: 10.1038/s43587-024-00612-4. Epub 2024 Apr 16.

Small extracellular vesicles from young plasma reverse age-related functional declines by improving mitochondrial energy metabolism

Affiliations

Small extracellular vesicles from young plasma reverse age-related functional declines by improving mitochondrial energy metabolism

Xiaorui Chen et al. Nat Aging. 2024 Jun.

Abstract

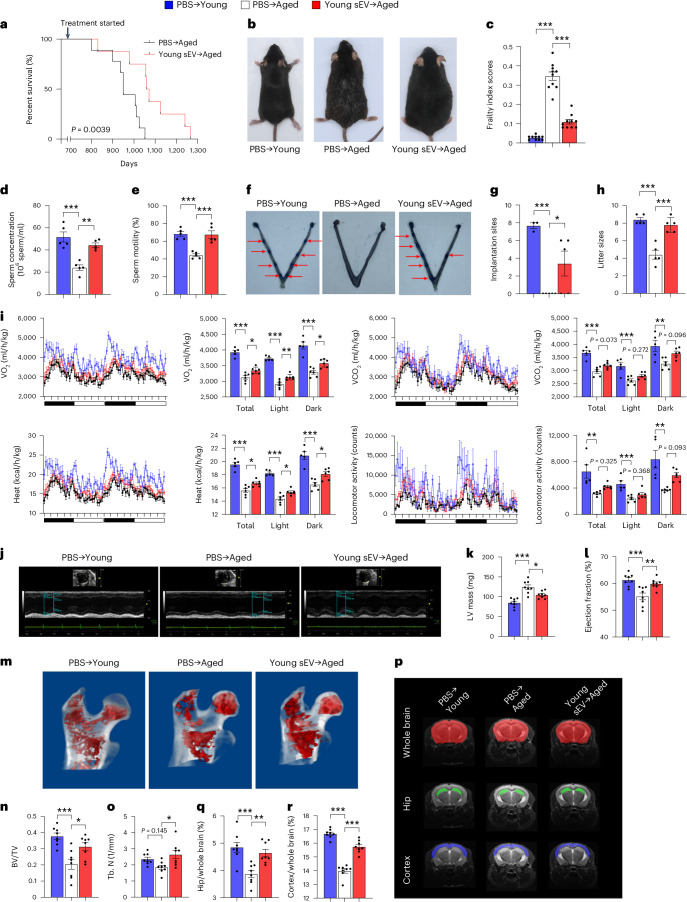
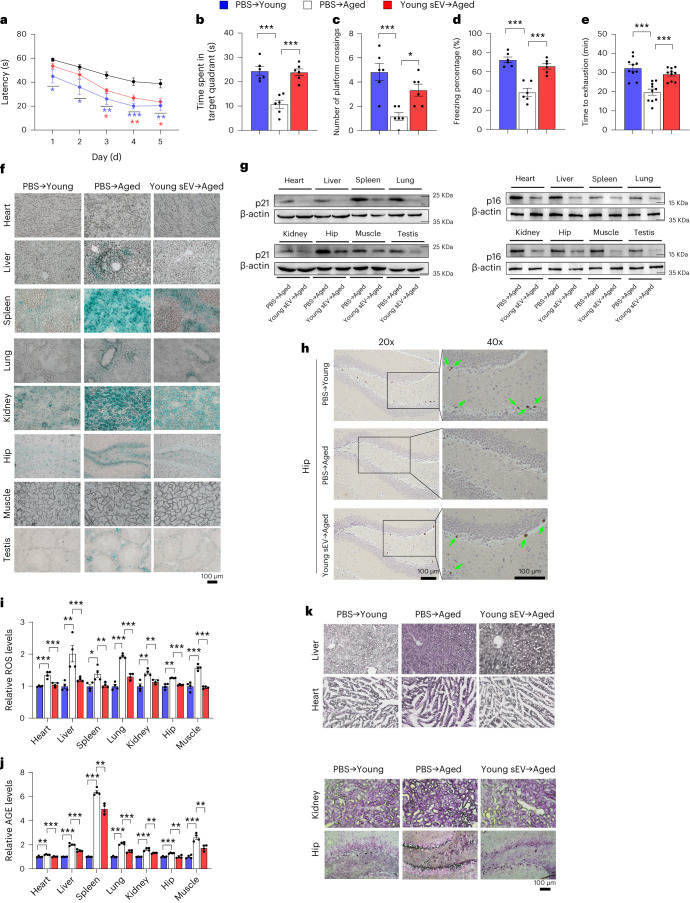
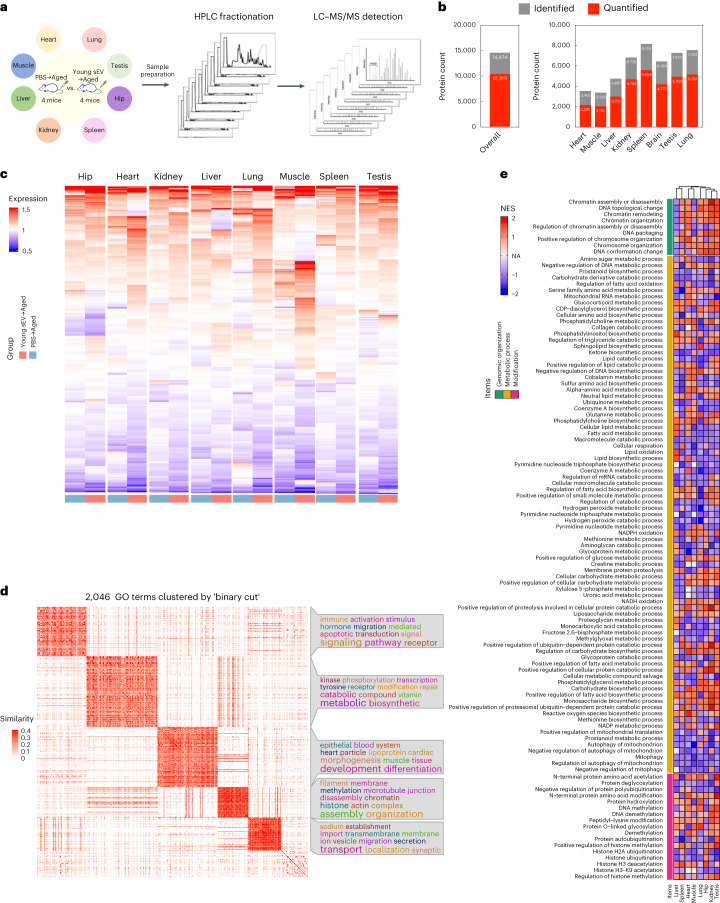
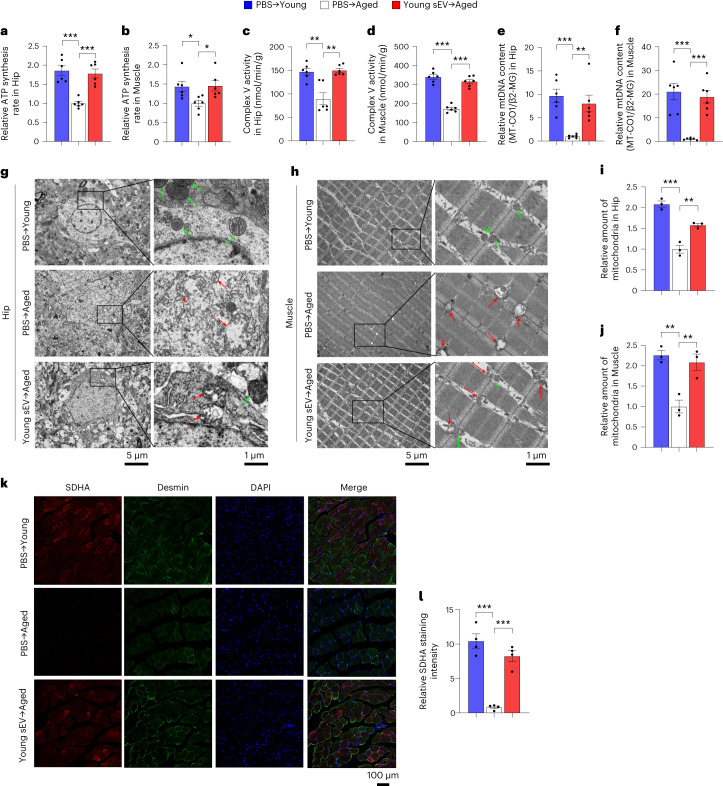
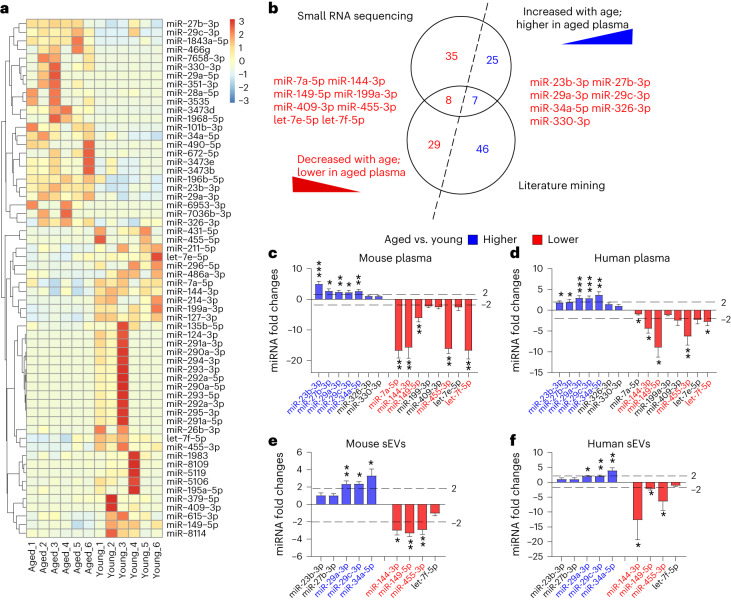
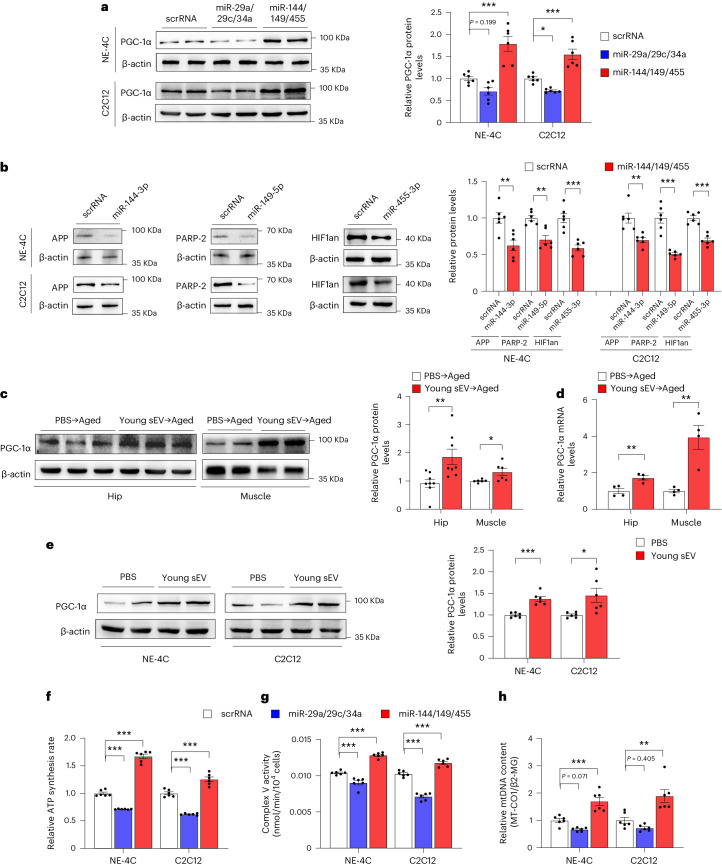
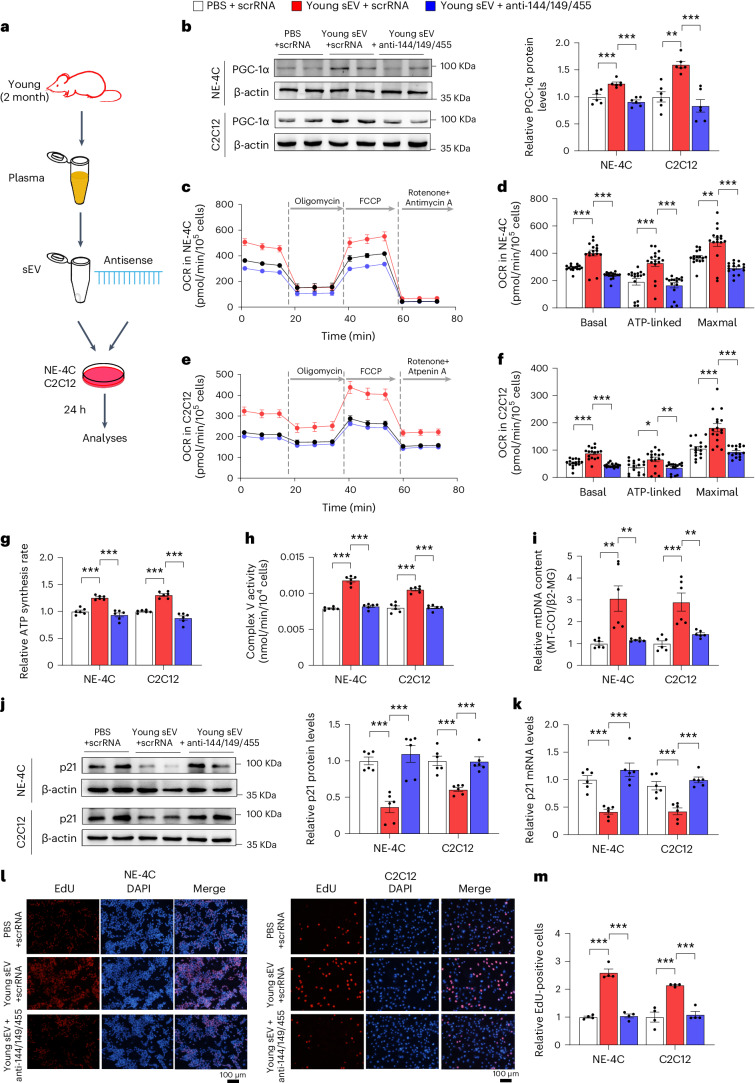
Recent investigations into heterochronic parabiosis have unveiled robust rejuvenating effects of young blood on aged tissues. However, the specific rejuvenating mechanisms remain incompletely elucidated. Here we demonstrate that small extracellular vesicles (sEVs) from the plasma of young mice counteract pre-existing aging at molecular, mitochondrial, cellular and physiological levels. Intravenous injection of young sEVs into aged mice extends their lifespan, mitigates senescent phenotypes and ameliorates age-associated functional declines in multiple tissues. Quantitative proteomic analyses identified substantial alterations in the proteomes of aged tissues after young sEV treatment, and these changes are closely associated with metabolic processes. Mechanistic investigations reveal that young sEVs stimulate PGC-1α expression in vitro and in vivo through their miRNA cargoes, thereby improving mitochondrial functions and mitigating mitochondrial deficits in aged tissues. Overall, this study demonstrates that young sEVs reverse degenerative changes and age-related dysfunction, at least in part, by stimulating PGC-1α expression and enhancing mitochondrial energy metabolism.


Conflict of interest statement

The authors declare no competing interests.

Figures

Fig. 1
Fig. 1. Long-term effects of young sEV injection on the lifespan and whole-body physiology of aged mice.
Aged male mice (20 months) were intravenously injected with 200 μl of PBS or young sEVs (2 months) once a week, and they were monitored to determine either the survival time or whole-body physiology. Young male mice (2 months) were simultaneously injected with PBS to serve as a control group. a, Kaplan–Meier survival curves in each group (n = 8–9). b, Representative images of mice in each group after 7 months of treatment. c, Mean frailty index scores in each group after 4 months of treatment (n = 10). d,e, Sperm counts and motility in each group (n = 5). f,g, The number of implantation sites visible as blue bands in the uterus of female mice that were mated with the male mice from each group. Representative images (red arrows indicate implantation sites) and quantitative data (n = 3 for PBS → Young; n = 5 for else) are shown. h, The number of offspring sired by the male mice in each group (n = 5). i, Indirect calorimetry measurements of O2 consumption, CO2 release, heat production and locomotor activity in each group (n = 5 for PBS → Young; n = 6 for else). jl, Echocardiographic measurements of cardiac dimensions and indices of cardiac function in each group. Representative M-mode echocardiographs and quantitative values of LV mass and EF (n = 8) are shown. mo, Micro-CT analysis of the trabecular microarchitecture of the proximal femur in each group. Representative 3D images of the proximal femur and quantitative values of BV/TV and Tb.N (n = 8) are shown. pr, MRI-based morphometric analyses of the hippocampus and cortex in each group. A representative MRI scan of a slice is shown, and the volume ratios (hippocampus/whole brain and cortex/whole brain) were calculated (n = 8). Significance was determined using the log-rank test in a and using one-way ANOVA followed by Dunnett’s multiple comparison test in ce, gi, k, l, n, o, q and r. *P < 0.05, **P < 0.01 and ***P < 0.005. Source data
Fig. 2
Fig. 2. Short-term effects of young sEV injection on memory ability, endurance performance and senescent phenotypes of aged mice.
Aged male mice (21 months) were intravenously injected with 200 μl of PBS or young sEVs (1.80 μg of total protein per microliter, from 2-month-old male mice) seven times over 2 weeks, and then the two groups of aged mice were either assessed by a series of behavioral paradigms to determine memory ability and endurance performance or assessed by multiple senescence biomarkers to determine senescent phenotypes. Young male mice (2 months) were simultaneously injected with PBS to serve as a control group. a, The escape latency of each group in the training phase of Morris water maze test (n = 6). Blue and red asterisks indicate statistically significant differences between PBS → Young versus PBS → Aged and between Young sEV → Aged versus PBS → Aged, respectively. b,c, Time spent in the target quadrant and the number of platform crossings by each group in the probe trial of Morris water maze test (n = 6). d, Freezing levels of each group in the contextual fear conditioning test (n = 6). e, Running time to exhaustion for each group in the treadmill running test (n = 10). f, Representative images of SA-β-gal staining in tissue sections. Scale bar, 100 μm. g, Western blot analysis of p21 and p16 protein levels in various tissues. Representative western blots are shown. h, Immunohistochemistry staining of Ki67 in the hippocampus sections. Representative immunohistochemistry staining images are shown. Scale bar, 100 μm. Ki-67-positive staining is identified by the presence of brown nuclear staining (green arrows) in cells. ij, Relative ROS and AGE levels in various tissues (n = 4). k, Representative images of aldehyde fuchsine staining for lipofuscin in tissue sections. Aldehyde fuchsine-positive staining appears dark purple in the sections. Scale bar, 100 μm. Each experiment was independently repeated four times with similar results in f and k. Significance was determined using one-way ANOVA followed by Dunnett’s multiple comparison test in ae, i and j. *P < 0.05, **P < 0.01 and ***P < 0.005. Source data
Fig. 3
Fig. 3. Young sEV treatment affects the proteomes of various aged tissues.
a, Flow chart of the experimental design. Aged male mice (21 months) were intravenously injected with 200 μl of PBS or young sEVs (from 2-month-old male mice) seven times over 2 weeks, and then the two groups of aged mice were euthanized to extract total protein from eight tissues (heart, liver, spleen, lung, kidney, hippocampus, muscle and testis). Approximately 100 μg of protein isolated from each tissue was used for iTRAQ experiments. b, The numbers of proteins identified and quantified overall and in each tissue are shown. c, Heatmap showing the distribution of proteins in each aged tissue from groups treated with young sEVs and PBS. d, Heatmap of the similarities of 2,046 GO terms exported from the leading-edge analysis of GSEA was generated using the ‘binary cut’ algorithm with the R package simplifyEnrichment. The ‘binary cut’ algorithm automatically extracts the biological descriptions for GO terms, clusters the similarity matrices of functional terms into groups and visualizes the biological functions of each group as word clouds in a similarity heatmap. The word cloud annotation visualizes the summaries of biological functions in each GO cluster. e, Heatmap of the differentially expressed GO terms in each aged tissue after treatment with young sEVs. The GO terms with a similar enrichment condition (>6 of 8 tissues had enrichment scores greater or less than 0) in clusters 2 and 4 were finally chosen for heatmap rendering. HPLC, high-performance liquid chromatography. NES, normalized enrichment score; NA, not apply.
Fig. 4
Fig. 4. Young sEV injection counteracts mitochondrial deficiency and improves metabolic health in aged mice.
Aged male mice (21 months) were intravenously injected with 200 μl of PBS or young sEVs (from 2-month-old male mice) seven times over 2 weeks, and then the two groups of aged mice were subjected to assessments of mitochondrial functional parameters and metabolic phenotypes. Young male mice (2 months) were simultaneously injected with PBS to serve as a control group. a,b, ATP synthesis rates in the hippocampus and muscle of each group (n = 6). c,d, Mitochondrial complex V activity in the hippocampus and muscle of each group (n = 6). e,f, Relative mtDNA content in the hippocampus and muscle of each group (n = 6). MT-CO1, normalized to β2-MG, was used to measure mtDNA copy number. g,h, Representative TEM images showing the structure and density of mitochondria in the hippocampus and muscle of each group. Normal mitochondria are round or oval shaped and contain well-defined cristae, whereas aged mitochondria become swollen, vacuolated and even broken, with cracked mitochondrial cristae. The green arrow indicates morphologically normal mitochondria, and the red arrow indicates morphologically damaged mitochondria. Scale bars, 5 µm in the left panel and 1 µm in the right panel. i,j, Quantification of the numbers of mitochondria in the sections (at low magnification) of hippocampus and muscle (n = 3). k,l, Immunofluorescence staining of SDHA (red), Desmin (green) and DAPI (blue) in the muscle fibers of each group. Representative images (scale bar, 100 μm) and quantification results (n = 4) are shown. Significance was determined using one-way ANOVA followed by Dunnett’s multiple comparison test in af, i, j and l. *P < 0.05, **P < 0.01 and ***P < 0.005. Source data
Fig. 5
Fig. 5. Young sEV treatment improves mitochondrial functions and attenuates H2O2-induced senescent phenotypes in cultured cells.
a, Flow chart of the experimental design. NE-4C or C2C12 cells (1 × 106 cells) were pretreated with H2O2 to induce cellular senescence and then incubated with 100 μl of PBS or young sEVs (from 2-month-old male mice) for 24 h, and then the cells were subjected to assessments of mitochondrial functional parameters and senescent phenotypes. Control cells were not treated with H2O2 but only with PBS. b,c, ATP synthesis rates in H2O2-induced NE-4C and C2C12 cells (n = 8). d,e, Mitochondrial complex V activity in H2O2-induced NE-4C and C2C12 cells (n = 6). f,g, Relative mtDNA content (MT-CO1/β2-MG) in H2O2-induced NE-4C and C2C12 cells (n = 6). hk, Measurement of OCR in H2O2-induced NE-4C and C2C12 cells. After measurement of basal OCR, oligomycin, FCCP and rotenone+antimycin A were sequentially added, and the alterations in OCR were recorded and normalized to cell number. Quantification of the basal OCR, ATP-coupled OCR and maximal OCR is shown (n = 6). l,m, Quantitative RT–PCR analysis of p21 mRNA levels in H2O2-induced NE-4C and C2C12 cells (n = 6). nq, EdU incorporation assay showing the proportion of proliferating cells in H2O2-induced NE-4C and C2C12 cells. Representative images (scale bar, 100 µm) and quantitative analysis of the percentage of EdU-positive cells (n = 5) are shown. Significance was determined using one-way ANOVA followed by Dunnett’s multiple comparison test in bg, i, km, o and q. *P < 0.05, **P < 0.01 and ***P < 0.005. Source data
Fig. 6
Fig. 6. Alteration in the miRNA contents in plasma and sEVs during the aging process.
a, Heatmap illustrating the differentially expressed plasma miRNAs (mean reads > 50, |fold change| > 2 and P < 0.05) in aged mouse plasma versus young mouse plasma (n = 6). b, Venn diagram showing the overlap of age-related circulating miRNAs that are identified by small RNA sequencing and literature mining. c,d, Fold changes of miRNAs in aged mouse plasma relative to young mouse plasma (n = 12) and in aged human plasma relative to young human plasma (n = 20). The blue box represents high relative expression level, and the red box represents low relative expression level. The names of miRNAs are marked with blue and red if they were significantly higher or lower in aged plasma versus young plasma (|fold change| > 2 and P < 0.05). e,f, Fold changes of miRNAs in aged mouse plasma sEVs relative to young mouse plasma sEVs (n = 4) and in aged human plasma sEVs relative to young human plasma sEVs (n = 6). The blue box represents high relative expression level, and the red box represents low relative expression level. The names of miRNAs are marked with blue and red if they were significantly higher or lower in aged plasma sEVs versus young plasma sEVs (|fold change| > 2 and P < 0.05). Significance was determined using two-sided Student’s t-test in cf. *P < 0.05, **P < 0.01 and ***P < 0.005. Source data
Fig. 7
Fig. 7. miRNAs in young and aged sEVs affect mitochondrial metabolism by regulating PGC-1α expression.
a, Western blot analysis of PGC-1α protein levels in NE-4C and C2C12 cells transfected with the scrRNA, a combination of miR-29a-3p, miR-29c-3p and miR-34a-5p mimics (miR-29a/29c/34a) or a combination of miR-144-3p, miR-149-5p and miR-455-3p mimics (miR-144/149/455). Left, representative western blots. Right, densitometric analysis (n = 6). b, Western blot analysis of APP, PARP-2 and HIF1an protein levels in NE-4C and C2C12 cells transfected with the scrRNA or the corresponding miRNA mimic. Left, representative western blots. Right, densitometric analysis (n = 6). c, Western blot analysis of PGC-1α protein levels in the hippocampus and muscle of aged mice injected with 200 μl of PBS or young mouse sEVs seven times over 2 weeks. Left, representative western blots. Right, densitometric analysis (n = 8 for hippocampus; n = 6 for muscle). d, Quantitative RT–PCR analysis of PGC-1α mRNA levels in the hippocampus and muscle of aged mice injected with 200 μl of PBS or young mouse sEVs seven times over 2 weeks (n = 4). e, Western blot analysis of PGC-1α protein levels in NE-4C and C2C12 cells incubated with 100 μl of PBS or young mouse sEVs for 24 h. Left, representative western blots. Right, densitometric analysis (n = 6). f, ATP synthesis rates in NE-4C and C2C12 cells transfected with scrRNA, miR-29a/29c/34a or miR-144/149/455 (n = 6). g, Mitochondrial complex V activity in NE-4C and C2C12 cells transfected with scrRNA, miR-29a/29c/34a or miR-144/149/455 (n = 6). h, Relative mtDNA content (MT-CO1/β2-MG) in NE-4C and C2C12 cells transfected with scrRNA, miR-29a/29c/34a or miR-144/149/455 (n = 6). Significance was determined using two-sided Student’s t-test in be and one-way ANOVA followed by Dunnett’s multiple comparison test in a and fh. *P < 0.05, **P < 0.01 and ***P < 0.005. Source data
Fig. 8
Fig. 8. Antisense oligonucleotides of miR-144-3p, miR-149-5p and miR-455-3p block the beneficial effects of young sEVs on mitochondrial metabolism and cell senescence.
a, Flow chart of the experimental design. NE-4C or C2C12 cells (1 × 106 cells) were treated with PBS plus scrRNA, young sEVs plus scrRNA or young sEVs plus antisense oligonucleotides of miR-144-3p, miR-149-5p and miR-455-3p (anti-miR-144/149/455) for 24 h, and then the cells were subjected to assessments of mitochondrial functional parameters and senescent phenotypes. b, Western blot analysis of PGC-1α protein levels in NE-4C and C2C12 cells. Left, representative western blots. Right, densitometric analysis (n = 6). cf, Measurement of OCR in NE-4C and C2C12 cells. After measurement of basal OCR, oligomycin, FCCP and rotenone+antimycin A were sequentially added, and the alterations in OCR were recorded and normalized to cell number. Quantification of the basal OCR, ATP-coupled OCR and maximal OCR is shown (n = 16). g, ATP synthesis rates in NE-4C and C2C12 cells (n = 6). h, Mitochondrial complex V activity in NE-4C and C2C12 cells (n = 6). i, Relative mtDNA content (MT-CO1/β2-MG) in NE-4C and C2C12 cells (n = 6). j, Western blot analysis of p21 protein levels in NE-4C and C2C12 cells. Left, representative western blots. Right, densitometric analysis (n = 6). k, Quantitative RT–PCR analysis of p21 mRNA levels in NE-4C and C2C12 cells (n = 6). l,m, EdU incorporation assay showing the proportion of proliferating cells in NE-4C and C2C12 cells. Representative images (scale bar, 100 µm) and quantitative analysis of the percentage of EdU-positive cells (n = 4) are shown. Significance was determined using one-way ANOVA followed by Dunnett’s multiple comparison test in b, d, fk and m. *P < 0.05, **P < 0.01 and ***P < 0.005. Source data

References

    1. Campisi J. Aging, cellular senescence, and cancer. Annu. Rev. Physiol. 2013;75:685–705. - PMC - PubMed
    1. Lopez-Otin C, Blasco MA, Partridge L, Serrano M, Kroemer G. The hallmarks of aging. Cell. 2013;153:1194–1217. - PMC - PubMed
    1. Bayersdorf, R. & Schumacher, B. Recent advances in understanding the mechanisms determining longevity. F1000Res.8 F1000 Faculty Rev-1403 (2019). - PMC - PubMed
    1. Angelini, F. et al. Getting old through the blood: circulating molecules in aging and senescence of cardiovascular regenerative cells. Front. Cardiovasc. Med.4, 62 (2017). - PMC - PubMed
    1. Conboy MJ, Conboy IM, Rando TA. Heterochronic parabiosis: historical perspective and methodological considerations for studies of aging and longevity. Aging Cell. 2013;12:525–530. - PMC - PubMed

MeSH terms

Substances