

Placental IGFBP1 levels during early pregnancy and the risk of insulin resistance and gestational diabetes
- PMID: 38627562
- PMCID: PMC11186792
- DOI: 10.1038/s41591-024-02936-5
Placental IGFBP1 levels during early pregnancy and the risk of insulin resistance and gestational diabetes
Abstract
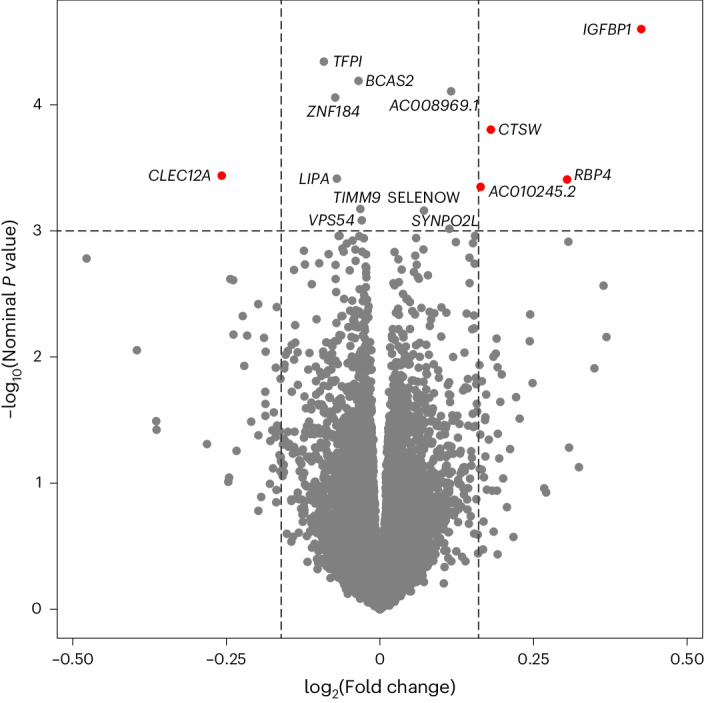
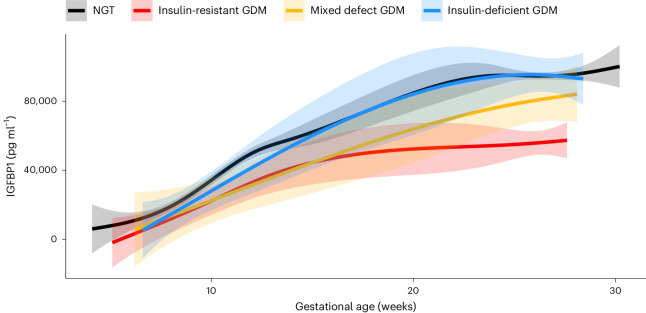
Reduced insulin sensitivity (insulin resistance) is a hallmark of normal physiology in late pregnancy and also underlies gestational diabetes mellitus (GDM). We conducted transcriptomic profiling of 434 human placentas and identified a positive association between insulin-like growth factor binding protein 1 gene (IGFBP1) expression in the placenta and insulin sensitivity at ~26 weeks gestation. Circulating IGFBP1 protein levels rose over the course of pregnancy and declined postpartum, which, together with high gene expression levels in our placenta samples, suggests a placental or decidual source. Higher circulating IGFBP1 levels were associated with greater insulin sensitivity (lesser insulin resistance) at ~26 weeks gestation in the same cohort and in two additional pregnancy cohorts. In addition, low circulating IGFBP1 levels in early pregnancy predicted subsequent GDM diagnosis in two cohorts of pregnant women. These results implicate IGFBP1 in the glycemic physiology of pregnancy and suggest a role for placental IGFBP1 deficiency in GDM pathogenesis.
© 2024. The Author(s).
Conflict of interest statement
C.E.P. is an Associate Editor of Diabetes Care, receives payments from Wolters Kluwer for UpToDate chapters on diabetes in pregnancy and has received payments for consulting and speaking from Mediflix. M.-F.H. is co-editor of textbook ‘Essentials of Clinical Nutrition in Healthcare’ published by McGraw Hill. F.A. has been an employee of Illumina since 8 November 2021. J.C.F. has received grant funding for an investigator-initiated proposal from Novo Nordisk, a one-time consulting honorarium from AstraZeneca and speaker fees from Merck and Novo Nordisk for scientific presentations over which he had full control of content. J.C.F.’s wife has received a one-time consulting honorarium from Novartis. A.G.E. serves as a consultant for Mirvie and receives research funding from Merck Pharmaceuticals outside of this work. None of these engagements are directly relevant to this work. The other authors declare no competing interests.
Figures


Update of
-
Placental RNA sequencing implicates IGFBP1 in insulin sensitivity during pregnancy and in gestational diabetes.Res Sq [Preprint]. 2023 Oct 27:rs.3.rs-3464151. doi: 10.21203/rs.3.rs-3464151/v1. Res Sq. 2023. Update in: Nat Med. 2024 Jun;30(6):1689-1695. doi: 10.1038/s41591-024-02936-5. PMID: 37961187 Free PMC article. Updated. Preprint.
References
-
- Magliano, D., Boyko, E. J. & IDF Diabetes Atlas 10th Edition Scientific Committee. in IDF Diabetes Atlas (eds Boyko, E. J. et al.) Ch. 3, Global picture (International Diabetes Federation, 2021); https://diabetesatlas.org/atlas/tenth-edition/
-
- Catalano PM, Kirwan JP, Haugel-de Mouzon S, King J. Gestational diabetes and insulin resistance: role in short- and long-term implications for mother and fetus. J. Nutr. 2003;133:1674S–1683S. - PubMed
-
- Barbour LA, et al. Cellular mechanisms for insulin resistance in normal pregnancy and gestational diabetes. Diabetes Care. 2007;30:S112–S119. - PubMed
-
- Sun Y, et al. Increasing insulin resistance predicts adverse pregnancy outcomes in women with gestational diabetes mellitus. J. Diabetes. 2020;12:438–446. - PubMed
MeSH terms
Substances
Grants and funding
- R01 HD094150/HD/NICHD NIH HHS/United States
- #20697/Fonds de Recherche du Québec - Santé (Fonds de la recherche en sante du Quebec)
- NHLBI K24 HL157960/U.S. Department of Health & Human Services | National Institutes of Health (NIH)
- #1-15-ACE-26 (to MFH)/American Diabetes Association (ADA)
- K24 HL157960/HL/NHLBI NIH HHS/United States
- #PJT-152989/Gouvernement du Canada | Canadian Institutes of Health Research (Instituts de Recherche en Santé du Canada)
- #MOP 115071/Gouvernement du Canada | Canadian Institutes of Health Research (Instituts de Recherche en Santé du Canada)
- R01HD094150/U.S. Department of Health & Human Services | National Institutes of Health (NIH)
- K23DK113218/U.S. Department of Health & Human Services | National Institutes of Health (NIH)
- K23 DK113218/DK/NIDDK NIH HHS/United States
- UL1 TR000170/TR/NCATS NIH HHS/United States
- UL1 TR001102/TR/NCATS NIH HHS/United States
LinkOut - more resources
Full Text Sources
Molecular Biology Databases
Research Materials
