. 2024 Jun 5;32(6):1970-1983.
doi: 10.1016/j.ymthe.2024.04.026. Epub 2024 Apr 16.

Defining mesenchymal stem/stromal cell-induced myeloid-derived suppressor cells using single-cell transcriptomics

Affiliations

Defining mesenchymal stem/stromal cell-induced myeloid-derived suppressor cells using single-cell transcriptomics

Hyun Ju Lee et al. Mol Ther. .

Abstract

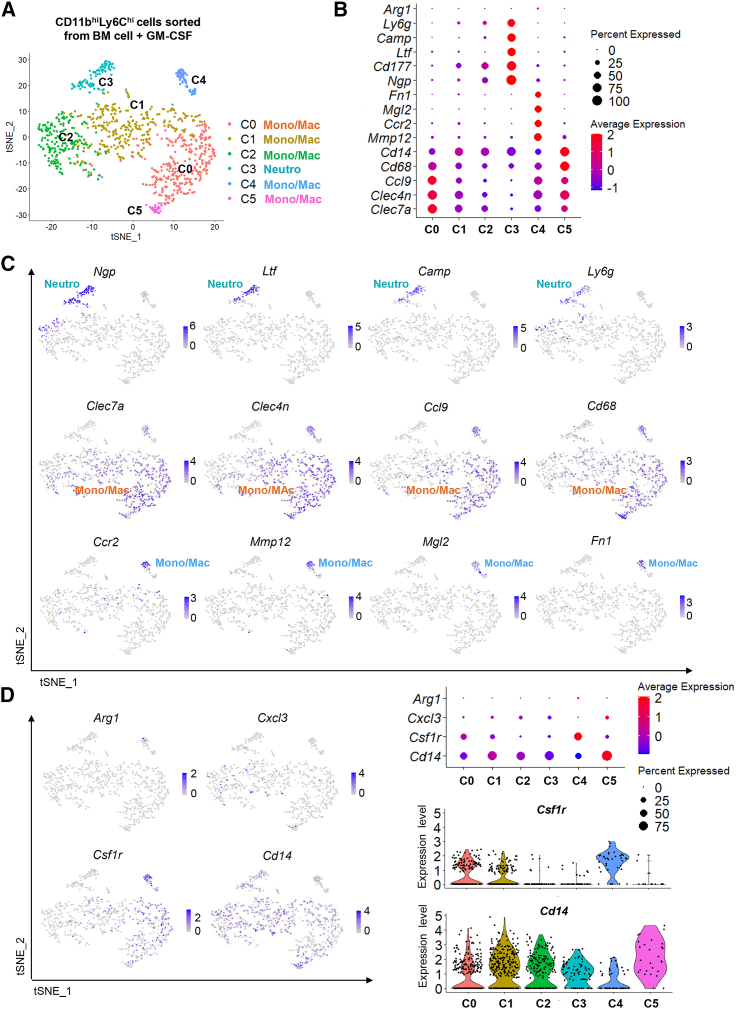
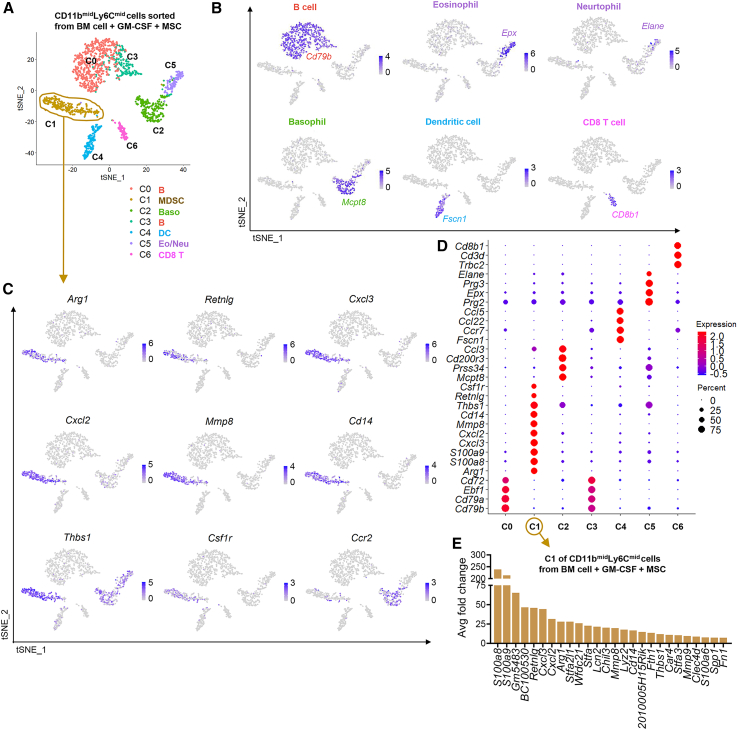
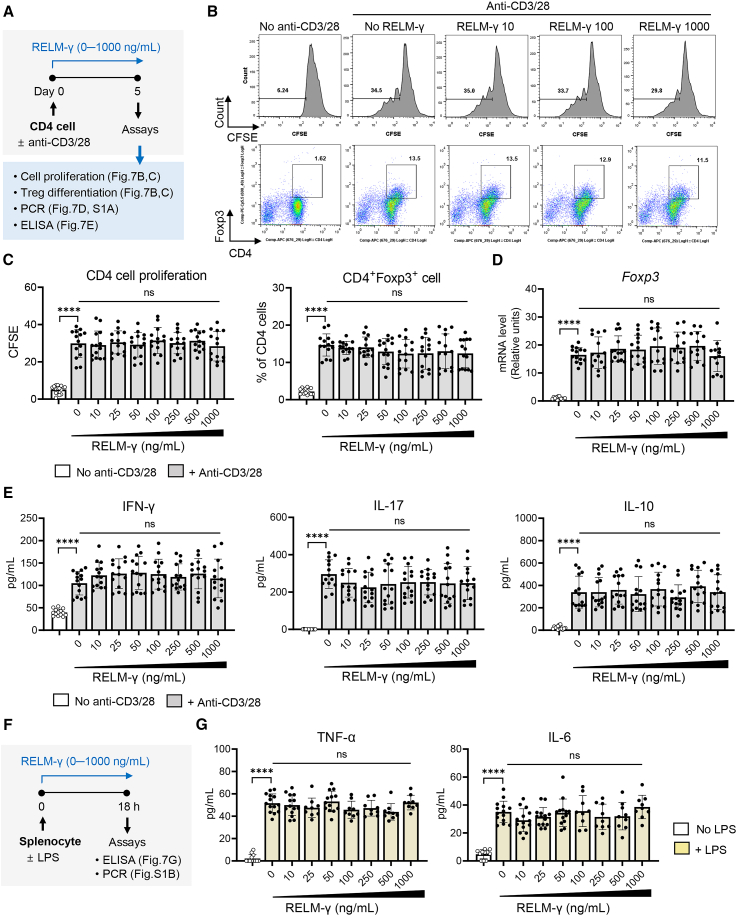
Mesenchymal stem/stromal cells (MSCs) modulate the immune response through interactions with innate immune cells. We previously demonstrated that MSCs alleviate ocular autoimmune inflammation by directing bone marrow cell differentiation from pro-inflammatory CD11bhiLy6ChiLy6Glo cells into immunosuppressive CD11bmidLy6CmidLy6Glo cells. Herein, we analyzed MSC-induced CD11bmidLy6Cmid cells using single-cell RNA sequencing and compared them with CD11bhiLy6Chi cells. Our investigation revealed seven distinct immune cell types including myeloid-derived suppressor cells (MDSCs) in the CD11bmidLy6Cmid cells, while CD11bhiLy6Chi cells included mostly monocytes/macrophages with a small cluster of neutrophils. These MSC-induced MDSCs highly expressed Retnlg, Cxcl3, Cxcl2, Mmp8, Cd14, and Csf1r as well as Arg1. Comparative analyses of CSF-1RhiCD11bmidLy6Cmid and CSF-1RloCD11bmidLy6Cmid cells demonstrated that the former had a homogeneous monocyte morphology and produced elevated levels of interleukin-10. Functionally, these CSF-1RhiCD11bmidLy6Cmid cells, compared with the CSF-1RloCD11bmidLy6Cmid cells, inhibited CD4+ T cell proliferation and promoted CD4+CD25+Foxp3+ Treg expansion in culture and in a mouse model of experimental autoimmune uveoretinitis. Resistin-like molecule (RELM)-γ encoded by Retnlg, one of the highly upregulated genes in MSC-induced MDSCs, had no direct effects on T cell proliferation, Treg expansion, or splenocyte activation. Together, our study revealed a distinct transcriptional profile of MSC-induced MDSCs and identified CSF-1R as a key cell-surface marker for detection and therapeutic enrichment of MDSCs.

Keywords: colony-stimulating factor-1 receptor; experimental autoimmune uveoretinitis; mesenchymal stem/stromal cell; myeloid-derived suppressor cell; resistin-like molecule-γ; single-cell RNA sequencing.


Conflict of interest statement

Declaration of interests The authors declare no competing interests.

Figures

None
Graphical abstract
Figure 1
Figure 1
Characterization of MSC-induced CD11bmidLy6Cmid cells in comparison with GM-CSF-stimulated CD11bhiLy6Chi cells by scRNA-seq (A) Experimental scheme. Single-cell suspensions of CD11bhiLy6Chi cells were sorted from BM cells cultured for 5 days in the presence of GM-CSF stimulation, and CD11bmidLy6Cmid cells were sorted from BM cells cocultured with MSCs in the presence of GM-CSF. Both cell suspensions were subjected to scRNA-seq. (B) Combined and separate tSNE plots of CD11bhiLy6Chi and CD11bmidLy6Cmid cells showing transcriptome distinction between two cell populations. (C) tSNE plot of CD11bhiLy6Chi cells depicting six distinct clusters (C0–C5) composed of two main immune cell types (monocytes/macrophages and neutrophils) as outlined by hallmark gene expression. (D) tSNE plot of CD11bmidLy6Cmid cells demonstrating seven distinct clusters (C0–C6) composed of seven immune cell types. The major cell types (B cells, MDSCs, DCs, basophils, eosinophils, neutrophils, and CD8 T cells) are outlined based on hallmark gene expression. (E) Heatmap displaying scaled expression patterns of top 10 genes within each cluster of CD11bhiLy6Chi cells. Yellow indicates high expression; purple indicates low expression. (F) Heatmap displaying scaled expression patterns of top 10 genes within each cluster of CD11bmidLy6Cmid cells. Yellow indicates high expression; purple indicates low expression.
Figure 2
Figure 2
Single-cell transcriptional profiling of GM-CSF-stimulated CD11bhiLy6Chi cells (A) Unbiased Seurat clustering analysis of CD11bhiLy6Chi cells isolated from GM-CSF-stimulated BM cells, projected in tSNE, identifying six distinct clusters annotated with monocytes/macrophages or neutrophils according to canonical marker gene expression. (B) Dot plot showing scaled expression of canonical marker genes in each cluster. The color represents the average expression level of each gene in each cluster scaled across all clusters. Red represents high expression; blue represents low expression. The dot size corresponds to the percentage of cells in each cluster expressing the gene (0%–100%). (C) Feature plots displaying canonical markers characteristic of two main cell types (neutrophils and monocytes/macrophages). Purple represents high expression; gray represents low expression. (D) Feature, dot, and violin plots showing expression of MDSC genes (Arg1 and Cxcl3) and monocyte marker genes (Csf1r and Cd14) by cluster. The number of dots inside each violin is proportional to the number of cells.
Figure 3
Figure 3
Single-cell transcriptional profiling of MSC-induced CD11bmidLy6Cmid cells (A) Unbiased Seurat clustering analysis of CD11bmidLy6Cmid cells sorted from MSC-cocultured BM cells under GM-CSF-stimulation, yielding seven clusters annotated with seven immune cell types. MDSCs characterized by Arg1 constitute cluster C1. (B) tSNE projection of canonical marker genes for B cells (Cd79b), eosinophils (Epx), neutrophils (Elane), basophils (Mcpt8), DCs (Fscn1), and CD8 T cells (Cd8b1). (C) Feature plots displaying expression of selected upregulated genes in cluster C1. (D) Dot plot showing scaled expression of hallmark genes in each cluster. Red represents high expression; blue represents low expression. The dot size represents the percentage of cells in each cluster expressing the gene (0%–75%). (E) Bar graph displaying average fold changes of top DEGs in MDSC cluster (C1) relative to all other cells.
Figure 4
Figure 4
Identification of cell-surface marker of MSC-induced MDSCs (A) Sorting strategy. CD11bmidLy6Cmid cells from GM-CSF-stimulated, MSC-cocultured BM cells were sorted based on CSF-1R expression into CSF-1RhiCD11bmidLy6Cmid and CSF-1RloCD11bmidLy6Cmid cells. (B) Giemsa staining of CSF-1RhiCD11bmidLy6Cmid and CSF-1RloCD11bmidLy6Cmid cells. Scale bar, 50 μm. (C) Validation using qRT-PCR of selected upregulated MDSC genes identified by scRNA-seq. The mRNA levels of each gene in the CSF-1RhiCD11bmidLy6Cmid cells are presented as fold changes relative to those in the CSF-1RloCD11bmidLy6Cmid cells. (D) ELISA for IL-10 levels in supernatants of CSF-1RhiCD11bmidLy6Cmid and CSF-1RloCD11bmidLy6Cmid cells cultured in presence of LPS for 18 h. Mean values ± SD are presented. ∗p < 0.05, ∗∗∗p < 0.001, ∗∗∗∗p < 0.0001, as analyzed by Student’s t test or Mann-Whitney U test (Retnlg and Mmp8).
Figure 5
Figure 5
Inhibition of T cell proliferation and expansion of Tregs by MSC-induced CSF-1RhiCD11bmidLy6Cmid cells (A) Experimental scheme. CSF-1RhiCD11bmidLy6Cmid and CSF-1RloCD11bmidLy6Cmid cells, sorted as described in Figure 4A, were cocultured with anti-CD3/anti-CD28-stimulated CD4+ cells for 5 days. (B and C) Representative and quantitative results of CFSE dilution assay for CD4+ cell proliferation and flow cytometric analysis of CD4+CD25+Foxp3+ cells. (D) ELISA for secreted levels of IFN-γ and IL-10 in cocultures of CD4+ cells with either CSF-1RhiCD11bmidLy6Cmid or CSF-1RloCD11bmidLy6Cmid cells. Mean values ± SD are presented. ∗p < 0.05, ∗∗p < 0.01, ∗∗∗p < 0.001, ∗∗∗∗p < 0.0001, as analyzed by one-way ANOVA and Tukey’s multiple-comparison test.
Figure 6
Figure 6
Amelioration of EAU by MSC-induced CSF-1RhiCD11bmidLy6Cmid cells (A) Experimental scheme. CSF-1RhiCD11bmidLy6Cmid cells or CSF-1RloCD11bmidLy6Cmid cells, sorted as in Figure 4A, were adoptively transferred into C57BL/6 mice after EAU induction. Three weeks later, the eyes and DLNs were analyzed. (B and C) Representative microphotographs of hematoxylin-eosin staining and CD3 immunostaining of retinal sections, with disease scores assigned based on histologic findings. Scale bar, 100 μm. (D) qRT-PCR for Il1b and Il12a in eye. mRNA levels are presented as fold changes relative to normal eyes without EAU. (E) Representative flow cytometry cytograms and quantitation of IFN-γ+CD4+, IL-17+CD4+, and CD4+CD25+Foxp3+ cells in DLNs. Mean values ± SD are presented, where each circle represents the data from an individual mouse. ∗p < 0.05, ∗∗p < 0.01, ∗∗∗p < 0.001, ∗∗∗∗p < 0.0001; ns, not significant, as analyzed either by one-way ANOVA and Tukey’s multiple-comparison test or by Kruskal-Wallis test with Dunn’s multiple-comparisons test (B, Il12a in D, IL-17+CD4+ cells in E).
Figure 7
Figure 7
Effects of RELM-γ on T cell proliferation, Treg expansion and splenocyte activation (A) Experimental scheme. CD4+ cells were treated with RELM-γ (0–1000 ng/mL) and cultured on anti-CD3/anti-CD28-coated plates for 5 days. Assays were performed to evaluate cell proliferation, differentiation and cytokine production. (B and C) Representative flow cytometry cytograms (B) and quantitation (C) of CFSE dilution and CD4+ Foxp3+ cells. (D) qRT-PCR for Foxp3 in CD4+ cells. (E) ELISA for IFN-γ, IL-17, and IL-10 in cell-free supernatants of CD4+ cell cultures. (F) Splenocyte stimulation assay. Splenocytes were treated with RELM-γ (0–1000 ng/mL) under LPS stimulation. After 18 h, the supernatants were assayed by ELISA, and the cells by qRT-PCR. (G) ELISA for secreted levels of TNF-α and IL-6 in splenocytes. Mean values ± SD are presented. ∗∗∗∗p < 0.0001; ns, not significant, as analyzed by one-way ANOVA and Tukey’s multiple-comparison test.

References

    1. Bronte V. The mesenchymal and myeloid regulation of immunity: Power is nothing without control. Semin. Immunol. 2018;35:1–2. - PubMed
    1. Cheung T.S., Dazzi F. Mesenchymal-myeloid interaction in the regulation of immunity. Semin. Immunol. 2018;35:59–68. - PubMed
    1. Oh J.Y., Lee R.H. Mesenchymal stromal cells for the treatment of ocular autoimmune diseases. Prog. Retin. Eye Res. 2021;85 - PMC - PubMed
    1. Lee H.J., Ko J.H., Kim H.J., Jeong H.J., Oh J.Y. Mesenchymal stromal cells induce distinct myeloid-derived suppressor cells in inflammation. JCI Insight. 2020;5 - PMC - PubMed
    1. Veglia F., Sanseviero E., Gabrilovich D.I. Myeloid-derived suppressor cells in the era of increasing myeloid cell diversity. Nat. Rev. Immunol. 2021;21:485–498. - PMC - PubMed