

stDiff: a diffusion model for imputing spatial transcriptomics through single-cell transcriptomics
- PMID: 38628114
- PMCID: PMC11021815
- DOI: 10.1093/bib/bbae171
stDiff: a diffusion model for imputing spatial transcriptomics through single-cell transcriptomics
Abstract
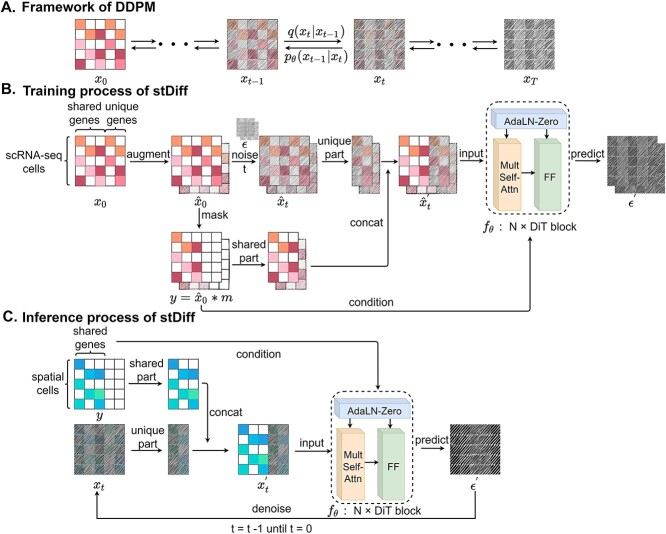
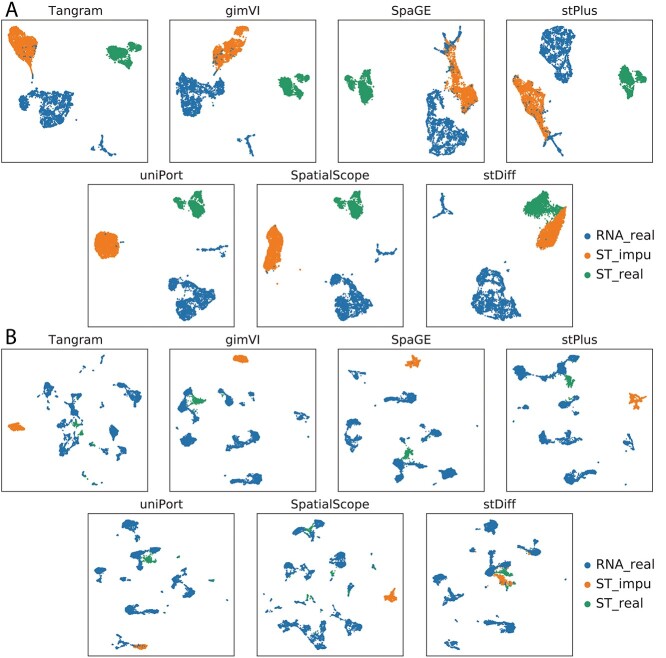
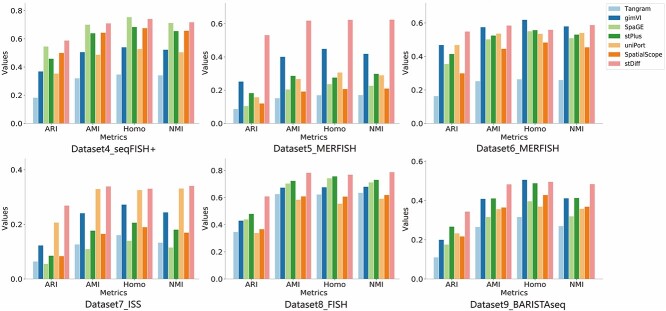
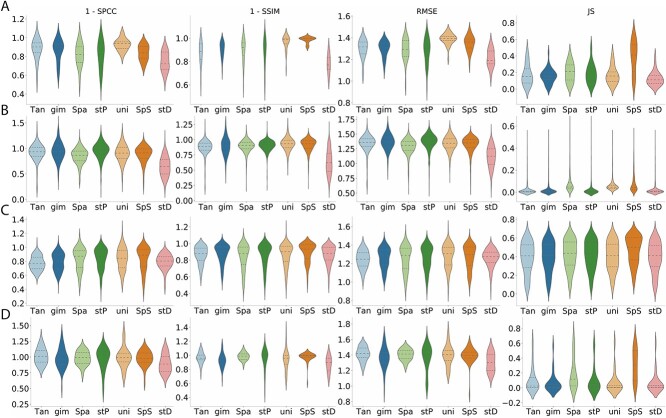
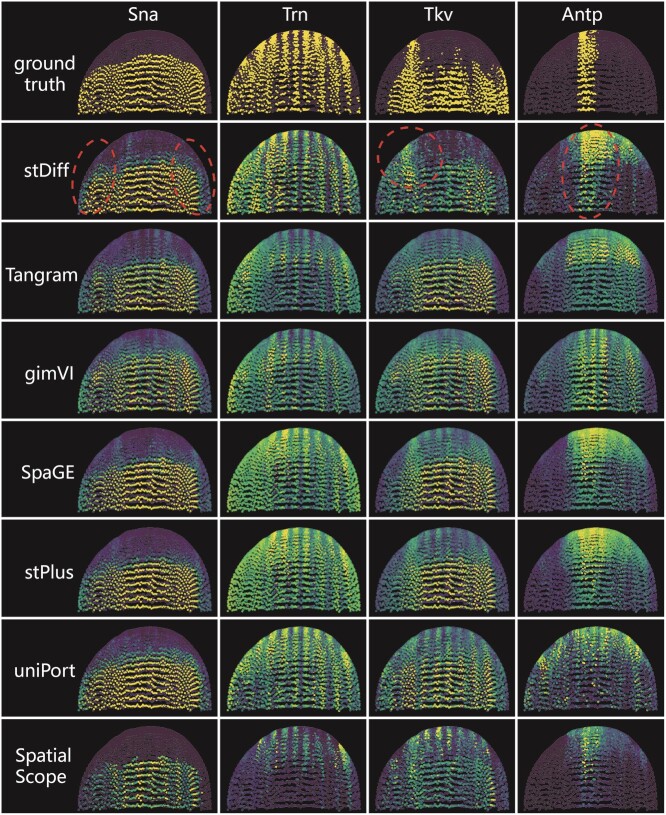
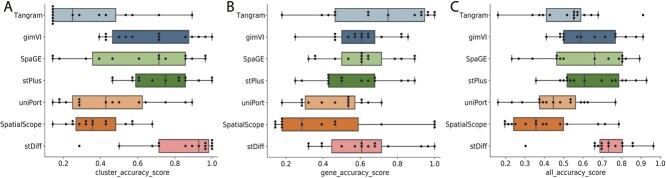
Spatial transcriptomics (ST) has become a powerful tool for exploring the spatial organization of gene expression in tissues. Imaging-based methods, though offering superior spatial resolutions at the single-cell level, are limited in either the number of imaged genes or the sensitivity of gene detection. Existing approaches for enhancing ST rely on the similarity between ST cells and reference single-cell RNA sequencing (scRNA-seq) cells. In contrast, we introduce stDiff, which leverages relationships between gene expression abundance in scRNA-seq data to enhance ST. stDiff employs a conditional diffusion model, capturing gene expression abundance relationships in scRNA-seq data through two Markov processes: one introducing noise to transcriptomics data and the other denoising to recover them. The missing portion of ST is predicted by incorporating the original ST data into the denoising process. In our comprehensive performance evaluation across 16 datasets, utilizing multiple clustering and similarity metrics, stDiff stands out for its exceptional ability to preserve topological structures among cells, positioning itself as a robust solution for cell population identification. Moreover, stDiff's enhancement outcomes closely mirror the actual ST data within the batch space. Across diverse spatial expression patterns, our model accurately reconstructs them, delineating distinct spatial boundaries. This highlights stDiff's capability to unify the observed and predicted segments of ST data for subsequent analysis. We anticipate that stDiff, with its innovative approach, will contribute to advancing ST imputation methodologies.
Keywords: diffusion model; imputation; scRNA-seq data; spatial transcriptomics data.
© The Author(s) 2024. Published by Oxford University Press.
Figures
Similar articles
-
SpaDiT: diffusion transformer for spatial gene expression prediction using scRNA-seq.Brief Bioinform. 2024 Sep 23;25(6):bbae571. doi: 10.1093/bib/bbae571. Brief Bioinform. 2024. PMID: 39508444 Free PMC article.
-
SpaIM: Single-cell Spatial Transcriptomics Imputation via Style Transfer.bioRxiv [Preprint]. 2025 Jan 27:2025.01.24.634756. doi: 10.1101/2025.01.24.634756. bioRxiv. 2025. Update in: Nat Commun. 2025 Aug 23;16(1):7861. doi: 10.1038/s41467-025-63185-9. PMID: 39975319 Free PMC article. Updated. Preprint.
-
stPlus: a reference-based method for the accurate enhancement of spatial transcriptomics.Bioinformatics. 2021 Jul 12;37(Suppl_1):i299-i307. doi: 10.1093/bioinformatics/btab298. Bioinformatics. 2021. PMID: 34252941 Free PMC article.
-
Computational solutions for spatial transcriptomics.Comput Struct Biotechnol J. 2022 Sep 1;20:4870-4884. doi: 10.1016/j.csbj.2022.08.043. eCollection 2022. Comput Struct Biotechnol J. 2022. PMID: 36147664 Free PMC article. Review.
-
A comprehensive comparison on cell-type composition inference for spatial transcriptomics data.Brief Bioinform. 2022 Jul 18;23(4):bbac245. doi: 10.1093/bib/bbac245. Brief Bioinform. 2022. PMID: 35753702 Free PMC article. Review.
Cited by
-
eMCI: An Explainable Multimodal Correlation Integration Model for Unveiling Spatial Transcriptomics and Intercellular Signaling.Research (Wash D C). 2024 Nov 1;7:0522. doi: 10.34133/research.0522. eCollection 2024. Research (Wash D C). 2024. PMID: 39494219 Free PMC article.
-
SpaDiT: diffusion transformer for spatial gene expression prediction using scRNA-seq.Brief Bioinform. 2024 Sep 23;25(6):bbae571. doi: 10.1093/bib/bbae571. Brief Bioinform. 2024. PMID: 39508444 Free PMC article.
-
Building a learnable universal coordinate system for single-cell atlas with a joint-VAE model.Commun Biol. 2024 Aug 12;7(1):977. doi: 10.1038/s42003-024-06564-0. Commun Biol. 2024. PMID: 39134617 Free PMC article.
-
SpaIM: Single-cell Spatial Transcriptomics Imputation via Style Transfer.bioRxiv [Preprint]. 2025 Jan 27:2025.01.24.634756. doi: 10.1101/2025.01.24.634756. bioRxiv. 2025. Update in: Nat Commun. 2025 Aug 23;16(1):7861. doi: 10.1038/s41467-025-63185-9. PMID: 39975319 Free PMC article. Updated. Preprint.
-
GEMDiff: a diffusion workflow bridges between normal and tumor gene expression states: a breast cancer case study.Brief Bioinform. 2025 Mar 4;26(2):bbaf093. doi: 10.1093/bib/bbaf093. Brief Bioinform. 2025. PMID: 40067113 Free PMC article.
References
-
- Codeluppi S, Borm LE, Zeisel A, et al. .. Spatial organization of the somatosensory cortex revealed by osmFISH. Nat Methods 2018;15(11):932–5. - PubMed
-
- Ståhl PL, Salmén F, Vickovic S, et al. .. Visualization and analysis of gene expression in tissue sections by spatial transcriptomics. Science 2016;353(6294):78–82. - PubMed
