. 2024 Jul;26(7):101141.
doi: 10.1016/j.gim.2024.101141. Epub 2024 Apr 15.

Lethal phenotypes in Mendelian disorders

Affiliations

Lethal phenotypes in Mendelian disorders

Pilar Cacheiro et al. Genet Med. 2024 Jul.

Abstract

Purpose: Existing resources that characterize the essentiality status of genes are based on either proliferation assessment in human cell lines, viability evaluation in mouse knockouts, or constraint metrics derived from human population sequencing studies. Several repositories document phenotypic annotations for rare disorders; however, there is a lack of comprehensive reporting on lethal phenotypes.

Methods: We queried Online Mendelian Inheritance in Man for terms related to lethality and classified all Mendelian genes according to the earliest age of death recorded for the associated disorders, from prenatal death to no reports of premature death. We characterized the genes across these lethality categories, examined the evidence on viability from mouse models and explored how this information could be used for novel gene discovery.

Results: We developed the Lethal Phenotypes Portal to showcase this curated catalog of human essential genes. Differences in the mode of inheritance, physiological systems affected, and disease class were found for genes in different lethality categories, as well as discrepancies between the lethal phenotypes observed in mouse and human.

Conclusion: We anticipate that this resource will aid clinicians in the diagnosis of early lethal conditions and assist researchers in investigating the properties that make these genes essential for human development.

Keywords: Essential genes; Lethal mouse knockouts; Lethal phenotypes; Mendelian disorders; Novel gene discovery.


Conflict of interest statement

Conflict of Interest The authors declare no conflicts of interest.

Figures

Figure 1
Figure 1. Current sources of gene intolerance to LoF variation or essentiality and lethal phenotypes.
The phenotypic impact of a gene’s LoF can be assessed in humans at the cellular level, through cell proliferation assays, observed versus expected variation inferred from large scale population sequencing data, and evaluation of lethal phenotypes in patients affected by Mendelian conditions. In the mouse, different viability assessment screens allow the identification of homozygous knockouts with pre-weaning lethal phenotypes. LoF: loss-of-function.
Figure 2
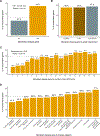
Figure 2. Association between Mendelian and mouse lethal genes.
(A) Mendelian genes and mouse viability. The set of Mendelian genes is significantly enriched for mouse lethal genes (OR 3.2; Pvalue < 2.2e-16). (B) Mode of inheritance and mouse viability. No significant differences are observed when disease genes are categorised according to the associated allelic requirement. (C) HPO terms and mouse viability. The percentage of mouse lethal genes among Mendelian disease genes is correlated with the number of physiological systems affected, as captured by the number of high level HPO terms (Spearman’s rank correlation rho = 0.93; Pvalue < 2.2e-16). (D) Disease categories and mouse viability. The percentage of mouse lethal genes is not uniform across disease categories. Mouse lethal genes from IMPC DR20.1 viability assessment (lethal + subviable); Mendelian disease genes, allelic requirement and disease category for those genes present in PanelApp with significant clinical evidence (green, diagnostic-grade); HPO top terms from gene-to-phenotypes Human Phenotype Ontology annotations. The dashed lines represent the baseline percentage of knockout lines with a one-to-one human orthologue that are lethal (lethal + subviable) (A) and the percentage of lethal (lethal + subviable) lines among Mendelian disease genes (B), (C), (D). OR: odds ratio; HPO: human phenotype ontology; IMPC: International Mouse Phenotyping Consortium.
Figure 3
Figure 3. Catalogue query and curation strategy, data integration and web resource.
(A) Web application. The resulting catalogue of lethal phenotypes is available to query and download through the following url: https://lethalphenotypes.research.its.qmul.ac.uk/. A set of annotations and visualisations allow the comparison between genes in different lethality categories in terms of intolerance to variation metrics, cell proliferation scores and mouse viability assessment. (B) Query strategy. OMIM query strategy and curation pipeline to classify OMIM Mendelian phenotype associated genes into lethality categories. (C) Distribution of OMIM lethal genes according to lethality categories. Bar plots represent the number (in white boxes) and percentage of genes in each lethality category with respect to all genes with records of early death. Genes with an associated earliest age of death in infancy are predominant among lethal genes.
Figure 4
Figure 4. Human phenotype ontology and disease category analysis of genes in the catalogue.
(A) Lethality categories and mode of inheritance. The set of pre-infant-lethal genes show a depletion of genes associated with an AD mode of inheritance. The bar plots represent the percentage of AD disease genes with respect to the total number of genes (white boxes) in each lethality category. (B) Lethality categories and prenatal phenotypes. Bar plots represent the percentage of genes in each lethality category with abnormalities of prenatal development. There is a correlation between the earliest age of death reported and the presence of abnormal prenatal phenotypes. (C) Lethality categories and abnormal phenotypes. The number of physiological systems affected is significantly higher among the lethal genes, implying more severe, multisystemic phenotypes (the numbers in the labels indicate the % of genes with HPO annotations mapping to <5 top HPO terms). (D) Lethality categories by affected systems. The percentage of genes in each category mapping to a specific physiological system is higher among the lethal genes for every single phenotype. (E) Lethality categories by disease group. The percentage of genes mapping to high level disease categories as per PanelApp (level 2 rare disease groups). OR: odds ratio; AD: autosomal dominant; L:lethal; NL: non-lethal; HPO: human phenotype ontology.
Figure 5
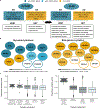
Figure 5. Gene group analysis of genes in the catalogue.
(A) Genes associated to AR disorders with lethal phenotypes and AD disorders with no records of premature death. Mouse viability for the homozygous and heterozygous knockout is concordant with the phenotype observed in humans. (B) Selected gene groups with potential novel candidate genes. Gene groups meeting the following criteria: 1) enriched for OMIM genes, and 2) enriched for genes in lethality categories pre-infant-lethal (Glycoside hydrolases) and non-lethal (Beta-gamma crystallins) respectively. Those genes in white filled circles correspond to potential candidate genes to be associated to Mendelian conditions. (C) Phenotypic similarity scores distribution of different pairwise comparisons for the two gene groups described in (B). Phenotype similarity scores between genes in the same gene group and lethality category compared to different subsets of genes belonging to different gene families and lethality categories. AR: autosomal recessive; AD: autosomal dominant; OR: odds ratio.
Figure 6
Figure 6. Evidence of lethality in human and mouse and potential reasons for discrepancies.
Human disease genes in the catalogue with a one-to-one mouse ortholog that has undergone the IMPC primary viability assessment (DR 20.1). Discrepancies in viability between the two organisms are highlighted, together with multiple hypothesis that could explain these differences for the two most extreme scenarios: 1) pre-infant lethal phenotypes in humans and pre-weaning viability in mouse, and 2) AR disease genes with no records of premature death in humans and pre-weaning lethal phenotypes in the mouse (complete or incomplete penetrance, i.e. lethal + subviable). AD: autosomal dominant; AR: autosomal recessive; LoF: loss-of-function; GoF: gain-of-function; IMPC: International Mouse Phenotyping Consortium.

Update of

Similar articles

Cited by

References

    1. Dickinson ME et al. High-throughput discovery of novel developmental phenotypes. Nature 537, 508-+ (2016). - PMC - PubMed
    1. Shamseldin HE et al. Identification of embryonic lethal genes in humans by autozygosity mapping and exome sequencing in consanguineous families. Genome Biology 16(2015). - PMC - PubMed
    1. Stanley KE et al. Causal Genetic Variants in Stillbirth. New England Journal of Medicine 383, 1107–1116 (2020). - PMC - PubMed
    1. Gao ZY, Waggoner D, Stephens M, Ober C. & Przeworski M. An Estimate of the Average Number of Recessive Lethal Mutations Carried by Humans. Genetics 199, 1243–1254 (2015). - PMC - PubMed
    1. Cacheiro P. et al. Human and mouse essentiality screens as a resource for disease gene discovery. Nature Communications 11(2020). - PMC - PubMed