

Impact of Lockdown Measures and Meteorological Parameters on the COVID-19 Incidence and Mortality Rate in Bangladesh
- PMID: 38630081
- PMCID: PMC8011345
- DOI: 10.1097/IM9.0000000000000052
Impact of Lockdown Measures and Meteorological Parameters on the COVID-19 Incidence and Mortality Rate in Bangladesh
Abstract
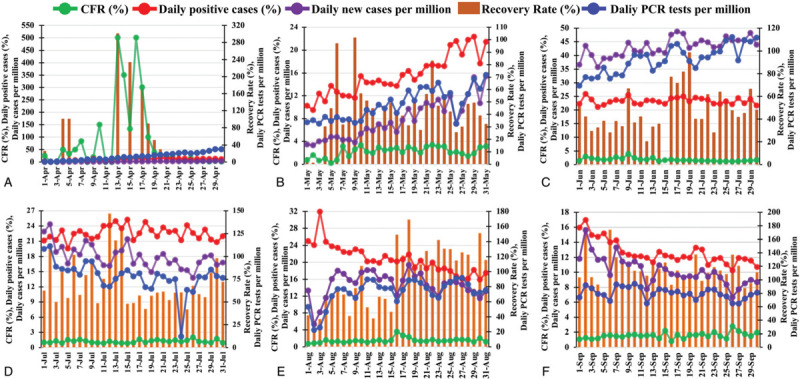
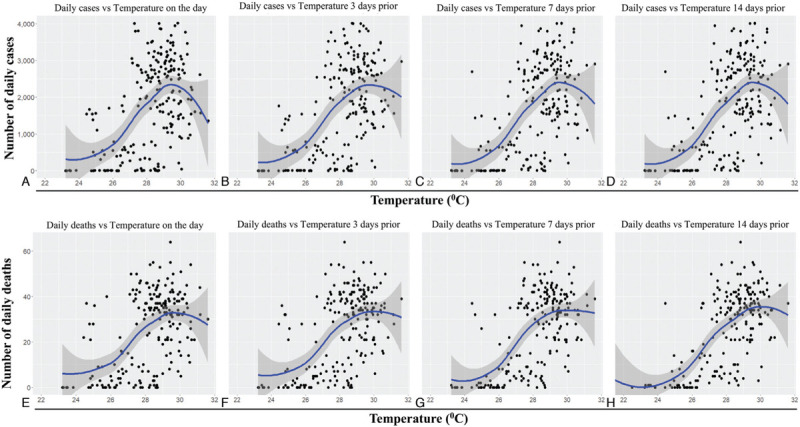
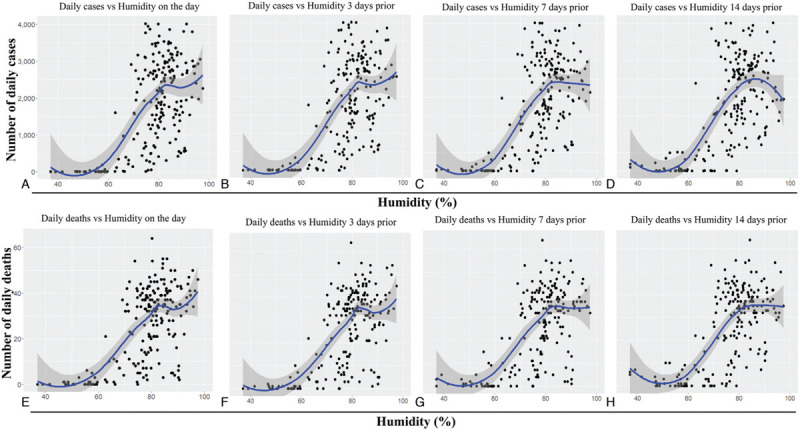
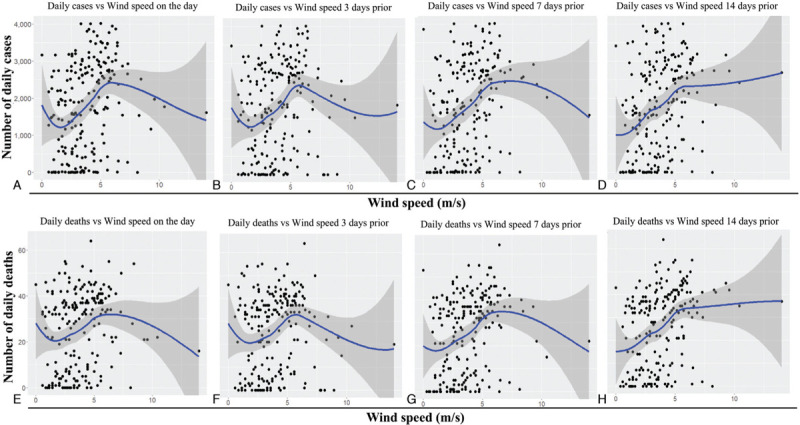
The coronavirus disease 2019 (COVID-19) pandemic has become a public health crisis and a global catastrophe for human societies. In the absence of a vaccine, non-pharmaceutical interventions have been implemented across the world to reduce COVID-19 transmission. Recently, several studies have articulated the influence of meteorological parameters on COVID-19 infections in several countries. The purpose of this study was to investigate the effect of lockdown measures and meteorological parameters on COVID-19 daily confirmed cases and deaths in Bangladesh. Different parameters, such as case fatality rate, recovery rate, number of polymerase chain reaction tests, and percentages of confirmed cases were calculated for data covering March to September 2020. The meteorological data include daily average temperature, humidity, and wind speed, and their effects on COVID-19 data were analyzed after 0, 3, 7, and 14 days. A linear regression analysis revealed that all the studied meteorological parameters were positively correlated with the daily new cases and deaths in Bangladesh, while the highest correlations were observed for the 14 days incubation period. These results provide useful implications for the healthcare authorities to contain the pandemic in Bangladesh and beyond.
Keywords: Bangladesh; COVID-19; case fatality rate; lockdown; meteorological parameters; non-pharmaceutical intervention.
Copyright © 2021 the Author(s). Published by Wolters Kluwer Health, Inc.
Conflict of interest statement
Conflict of Interest: The authors reported no conflict of interest.
Figures

Similar articles
-
Impact of meteorological parameters on COVID-19 transmission in Bangladesh: a spatiotemporal approach.Theor Appl Climatol. 2021;144(1-2):273-285. doi: 10.1007/s00704-021-03535-x. Epub 2021 Feb 3. Theor Appl Climatol. 2021. PMID: 33551528 Free PMC article.
-
Effects of meteorological parameters on COVID-19 transmission trends in Bangladesh.Environ Sustain (Singap). 2021;4(3):559-568. doi: 10.1007/s42398-021-00195-5. Epub 2021 Jun 6. Environ Sustain (Singap). 2021. PMID: 38624919 Free PMC article.
-
Insight into vaccination and meteorological factors on daily COVID-19 cases and mortality in Bangladesh.Groundw Sustain Dev. 2023 May;21:100932. doi: 10.1016/j.gsd.2023.100932. Epub 2023 Mar 2. Groundw Sustain Dev. 2023. PMID: 36945723 Free PMC article.
-
Systematic Assessment of COVID-19 Pandemic in Bangladesh: Effectiveness of Preparedness in the First Wave.Front Public Health. 2021 Oct 21;9:628931. doi: 10.3389/fpubh.2021.628931. eCollection 2021. Front Public Health. 2021. PMID: 34746068 Free PMC article.
-
The emergence of novel coronavirus disease (COVID-19) in Bangladesh: Present status, challenges, and future management.J Adv Vet Anim Res. 2020 Mar 22;7(2):198-208. doi: 10.5455/javar.2020.g410. eCollection 2020 Jun. J Adv Vet Anim Res. 2020. PMID: 32607350 Free PMC article. Review.
Cited by
-
Investigating the possible origin and transmission routes of SARS-CoV-2 genomes and variants of concern in Bangladesh.Infect Genet Evol. 2021 Nov;95:105057. doi: 10.1016/j.meegid.2021.105057. Epub 2021 Sep 1. Infect Genet Evol. 2021. PMID: 34481060 Free PMC article.
-
Transmission Dynamics and Genomic Epidemiology of Emerging Variants of SARS-CoV-2 in Bangladesh.Trop Med Infect Dis. 2022 Aug 20;7(8):197. doi: 10.3390/tropicalmed7080197. Trop Med Infect Dis. 2022. PMID: 36006289 Free PMC article.
References
-
- World Health Organization. Middle East respiratory syndrome coronavirus (MERS-CoV). Available from: http://www.who.int/emergencies/mers-cov/en/. Accessed October 08, 2020.
-
- Worldometer. COVID-19 Coronavirus Pandemic Update. Available from: https://www.worldometers.info/coronavirus/. Accessed October 08, 2020.
LinkOut - more resources
Full Text Sources