. 2024 Jun;67(6):1066-1078.
doi: 10.1007/s00125-024-06143-2. Epub 2024 Apr 17.

A 3D atlas of the human developing pancreas to explore progenitor proliferation and differentiation

Affiliations

A 3D atlas of the human developing pancreas to explore progenitor proliferation and differentiation

Adrian Villalba et al. Diabetologia. 2024 Jun.

Abstract

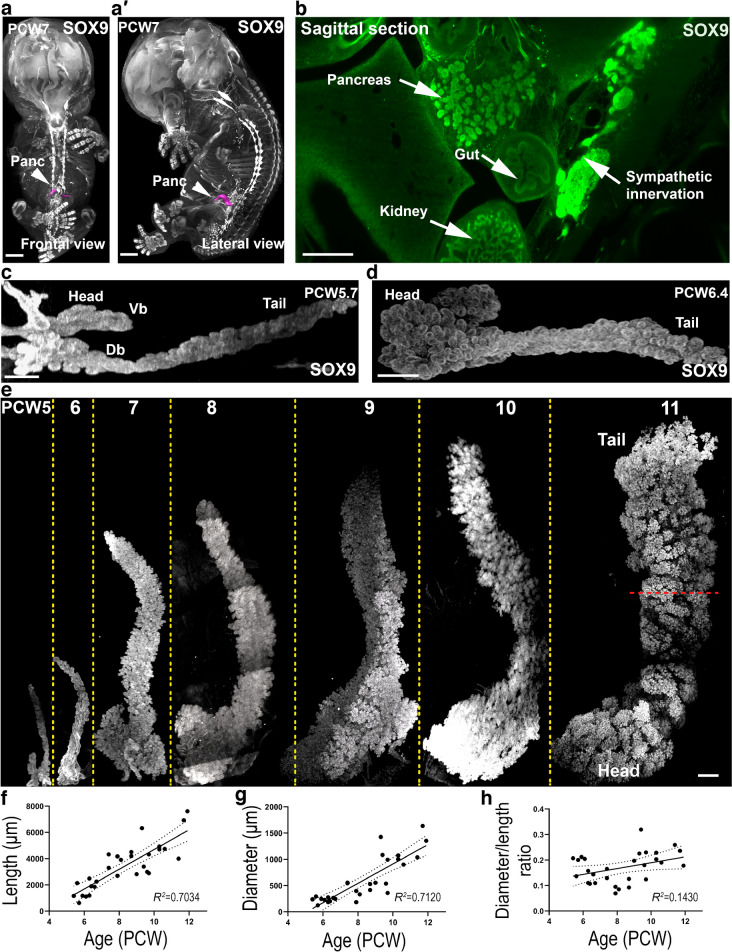
Aims/hypothesis: Rodent pancreas development has been described in great detail. On the other hand, there are still gaps in our understanding of the developmental trajectories of pancreatic cells during human ontogenesis. Here, our aim was to map the spatial and chronological dynamics of human pancreatic cell differentiation and proliferation by using 3D imaging of cleared human embryonic and fetal pancreases.

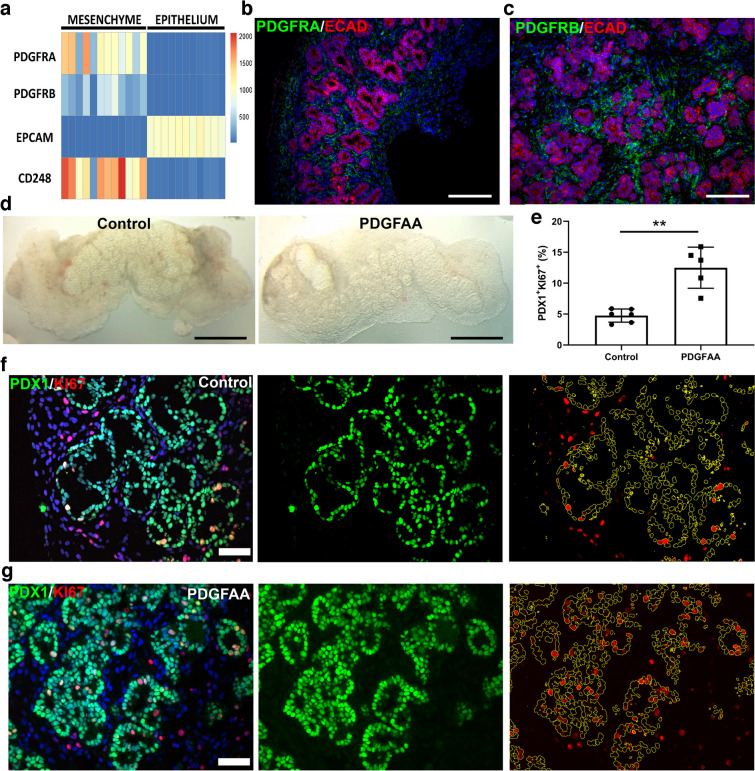
Methods: We combined tissue clearing with light-sheet fluorescence imaging in human embryonic and fetal pancreases during the first trimester of pregnancy. In addition, we validated an explant culture system enabling in vitro proliferation of pancreatic progenitors to determine the mitogenic effect of candidate molecules.

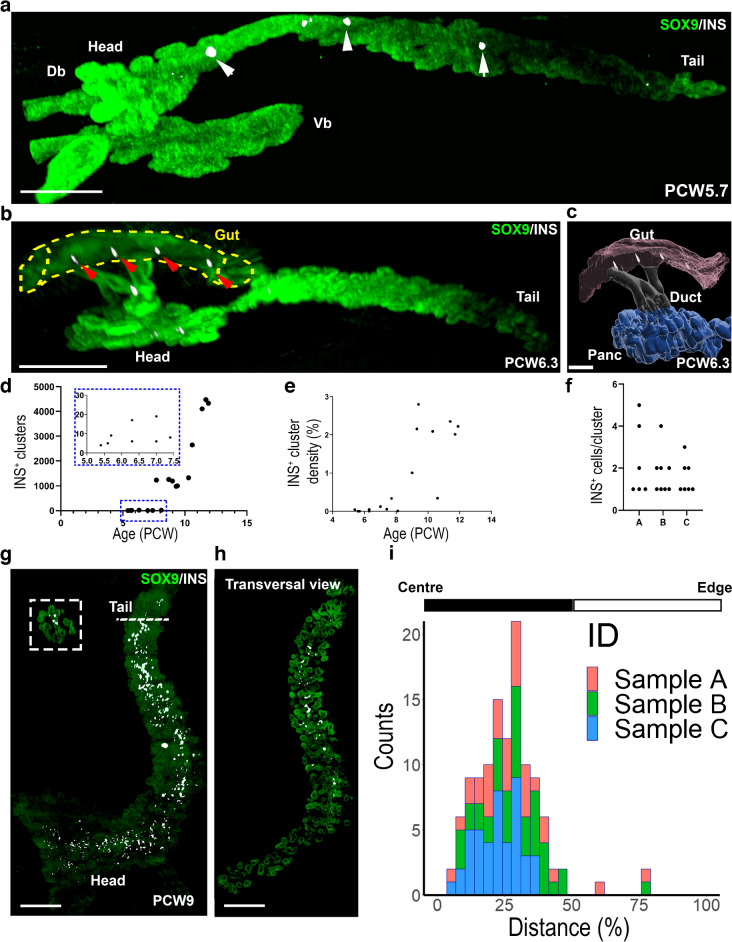
Results: We detected the first insulin-positive cells as early as five post-conceptional weeks, two weeks earlier than previously observed. We observed few insulin-positive clusters at five post-conceptional weeks (mean ± SD 9.25±5.65) with a sharp increase to 11 post-conceptional weeks (4307±152.34). We identified a central niche as the location of onset of the earliest insulin cell production and detected extra-pancreatic loci within the adjacent developing gut. Conversely, proliferating pancreatic progenitors were located in the periphery of the epithelium, suggesting the existence of two separated pancreatic niches for differentiation and proliferation. Additionally, we observed that the proliferation ratio of progenitors ranged between 20% and 30%, while for insulin-positive cells it was 1%. We next unveiled a mitogenic effect of the platelet-derived growth factor AA isoform (PDGFAA) in progenitors acting through the pancreatic mesenchyme by increasing threefold the number of proliferating progenitors.

Conclusions/interpretation: This work presents a first 3D atlas of the human developing pancreas, charting both endocrine and proliferating cells across early development.

Keywords: Human fetal pancreas; Insulin-producing cells; Light-sheet fluorescence microscopy; PDGF signalling; Pancreatic progenitors; Proliferating cells; Type 1 diabetes.


Figures

Fig. 1
Fig. 1
Human embryonic and fetal pancreases display isometric growth from PCW5 to 11. LSFM images of embryonic and fetal pancreases (ae) immunostained for SOX9 or SOX9 and TH (a, a′, b). (a, a′) Frontal and lateral 3D views of a PCW7 human embryo revealing the anatomical location of the human pancreas (magenta). SOX9 is expressed in the cartilage and various organs including the pancreas. (b) Sagittal z-stack section of the PCW7 human embryo from Fig. 1a locating the pancreas and adjacent tissues. (c, d) At PCW5.7, SOX9 staining labels both ventral and dorsal buds, which have fused at PCW6.4. (e) Tridimensional SOX9 immunostaining (white) in whole-mount pancreases dissected from human embryos and fetuses between PCW5 and 11. Dashed red line depicts the diameter of the organ. (fh) Determination of the length (f), the diameter (g), and the diameter to length ratio (h) of the pancreases from PCW5–11. Scale bars: 2 mm (a, a′), 500 µm (b, e), 200 µm (c, d). Db, dorsal bud; Panc, pancreas; TH, tyrosine hydroxylase; Vb, ventral bud
Fig. 2
Fig. 2
Spatial and time determination of INS+ cell location in the pancreatic primordium. LSFM images of embryonic and fetal pancreases (a, b, g, h) immunostained for SOX9 (green) and INS (white). (a) At PCW5.7, a few clusters of insulin-immunoreactive (INS+) cells (see white arrows) are found at the centre of the dorsal bud. (b) Representative image of extra-pancreatic INS+ cells that were detected in a gut region adjacent to the head of the pancreas (see red arrows) (PCW 6.3) (n=4 pancreases). (c) Segmentation of the pancreas, the gut tube and ducts from Fig. 2b, showing the gut region next to the pancreas containing INS+ clusters. (d) Determination of the number of INS+ clusters from PCW5–11. (e) Determination of INS+ cluster density (volume of INS+ cluster /volume SOX9+ epithelium) from PCW5–11. (f) Quantification of the number of INS+ cells per cluster at PCW6, full sectioned and stained to include all the INS+ clusters (n=3) in three different samples (named A, B, and C). (g) At PCW9, INS+ clusters are aligned to the centre of the pancreas as shown in 3D. The dashed line represents a sagittal section. (h) Transversal view of Fig. 2g. (i) Histogram showing the distribution of the INS+ clusters across the pancreatic epithelium in 2D sections from three PCW8 specimens (samples A, B and C). The x-axis represents the distance of the INS+ clusters to the centre of the pancreas. Scale bars: 250 µm (a), 300 µm (b), 50 µm (c), 200µm (g, h). Db, dorsal bud; Panc, pancreas; Vb, ventral bud
Fig. 3
Fig. 3
Proliferation of human embryonic and fetal pancreatic cells. (a, b) Representative staining for PDX1 (green) and KI67 (red) on sections of human fetal pancreas at PCW9 and quantification of the frequency of PDX1+/Ki67+ at PCW7, 9 and 11 (n=3). (c, d) Representative staining for INS (green) and KI67 (red) on sections of human fetal pancreas at PCW9 and quantification of the frequency of INS+/Ki67+ at PCW9 and 11. Inset reveals a single INS+KI67+ cell. (e) Heatmap showing the expression of cell cycle-related genes in three successive populations of pancreatic progenitors: ECAD+CD142+ (pink); ECAD+CD142 (green); ECADlowCD142SUSD2+ (blue). The heatmap was generated by the ‘heatmap2’ function from gplots R package (https://cran.r-project.org/web/packages/gplots/) on standardised log2 expression values from Ramond et al 2018 [15], with Pearson correlation as the distance function. (f) Proliferating pancreatic progenitors (PDX1+/EdU+) across the pancreatic epithelium. PDX1 in green, EdU in red and ECAD in white (n=6). (g) Computation of the Ripley K function [K(r), with r being the distance in pixels from one cell to the closest one] to determine the distribution pattern of PDX1+KI67+ progenitors in 2D images at PCW7, 9 and 11. Red lines represent the random distribution while each black line represents the quantification of K(r) for PDX1+KI67+ progenitors in a single 2D image. (h) Expected output of K(r) computed for three different types of spatial distribution: random, aggregate and regular. (i) Determination of the cell identity of peripheral pancreatic cells. CPA1 in green and KI67 in red in a human fetal pancreas at PCW11. Scale bars: 100 µm (a, c), 500 µm (f), 1 mm (i)
Fig. 4
Fig. 4
Effect of PDGFAA in explants of human embryonic and fetal pancreases. (a) Heatmap showing the expression of PDGFRA and PDGFRB in the mesenchymal and epithelial fraction of human fetal pancreases. Epithelial (epithelial cellular adhesion molecule [EPCAM]) and mesenchymal (CD248) markers are used as positive controls for each population. The heatmap was generated as described in the legend for Fig. 3e with expression values from Ramond et al 2017 [14]. (b, c) Expression pattern of PDGFRA and PDGFRB (green) in a human fetal pancreas at PCW10, ECAD is in red. (d) Macroscopic integrity of the tissue at day 7 of culture in control or treated samples. (e) Determination of the proliferation ratio for pancreatic progenitors at day 7 cultured in DMEM/F12 supplemented medium treated or not with PDFGAA (n=5–6). Mean ± SD. (f, g) Representative images of control and treated (PDGFAA) samples at day 7 cultured in DMEM/F12 supplemented medium stained with PDX1 (green) and KI67 (red). Scale bars: 150 µm (b, c, f, g), 1 mm (d)

References

    1. Shih HP, Wang A, Sander M. Pancreas organogenesis: from lineage determination to morphogenesis. Annu Rev Cell Dev Biol. 2013;29:81–105. doi: 10.1146/ANNUREV-CELLBIO-101512-122405. - DOI - PubMed
    1. Atkinson MA, Campbell-Thompson M, Kusmartseva I, Kaestner KH. Organisation of the human pancreas in health and in diabetes. Diabetologia. 2020;63(10):1966–1973. doi: 10.1007/s00125-020-05203-7. - DOI - PMC - PubMed
    1. Pan FC, Wright C. Pancreas organogenesis: from bud to plexus to gland. Dev Dyn. 2011;240(3):530–565. doi: 10.1002/DVDY.22584. - DOI - PubMed
    1. Siehler J, Blöchinger AK, Meier M, Lickert H. Engineering islets from stem cells for advanced therapies of diabetes. Nat Rev Drug Discov. 2021;20(12):920–940. doi: 10.1038/S41573-021-00262-W. - DOI - PubMed
    1. Isaacson A, Spagnoli FM. Pancreatic cell fate specification: insights into developmental mechanisms and their application for lineage reprogramming. Curr Opin Genet Dev. 2021;70:32–39. doi: 10.1016/J.GDE.2021.05.003. - DOI - PubMed

Publication types

LinkOut - more resources