. 2024 Apr 17;44(1):35.
doi: 10.1007/s10571-024-01467-4.

FoxG1 as a Potential Therapeutic Target for Alzheimer's Disease: Modulating NLRP3 Inflammasome via AMPK/mTOR Autophagy Pathway

Affiliations

FoxG1 as a Potential Therapeutic Target for Alzheimer's Disease: Modulating NLRP3 Inflammasome via AMPK/mTOR Autophagy Pathway

Qi Yun et al. Cell Mol Neurobiol. .

Abstract

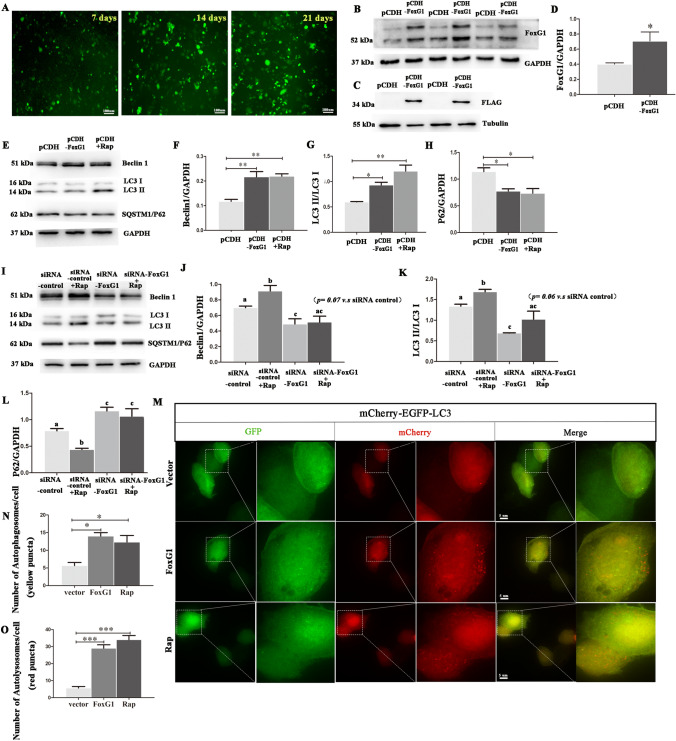
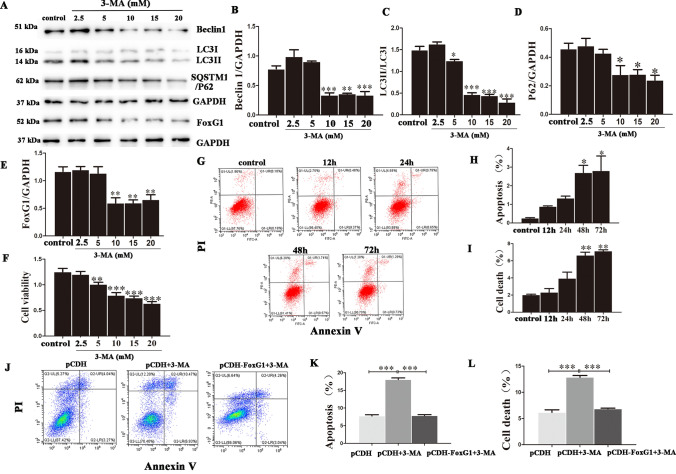
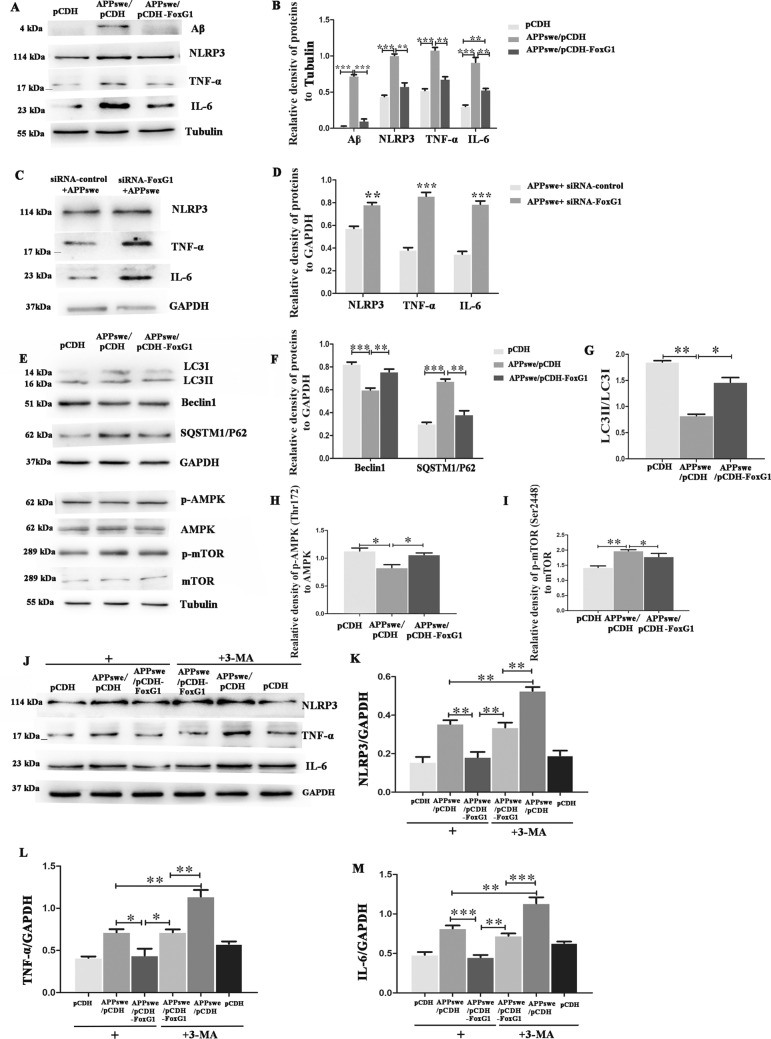
An increasing body of research suggests that promoting microglial autophagy hinders the neuroinflammation initiated though the NLRP3 inflammasome activation in Alzheimer's disease (AD). The function of FoxG1, a crucial transcription factor involved in cell survival by regulating mitochondrial function, remains unknown during the AD process and neuroinflammation occurs. In the present study, we firstly found that Aβ peptides induced AD-like neuroinflammation upregulation and downregulated the level of autophagy. Following low-dose Aβ25-35 stimulation, FoxG1 expression and autophagy exhibited a gradual increase. Nevertheless, with high-concentration Aβ25-35 treatment, progressive decrease in FoxG1 expression and autophagy levels as the concentration of Aβ25-35 escalated. In addition, FoxG1 has a positive effect on cell viability and autophagy in the nervous system. In parallel with the Aβ25-35 stimulation, we employed siRNA to decrease the expression of FoxG1 in N2A cells. A substantial reduction in autophagy level (Beclin1, LC3II, SQSTM1/P62) and a notable growth in inflammatory response (NLRP3, TNF-α, and IL-6) were observed. In addition, we found FoxG1 overexpression owned the effect on the activation of AMPK/mTOR autophagy pathway and siRNA-FoxG1 successfully abolished this effect. Lastly, FoxG1 suppressed the NLRP3 inflammasome and enhanced the cognitive function in AD-like mouse model induced by Aβ25-35. Confirmed by cellular and animal experiments, FoxG1 suppressed NLRP3-mediated neuroinflammation, which was strongly linked to autophagy regulated by AMPK/mTOR. Taken together, FoxG1 may be a critical node in the pathologic progression of AD and has the potential to serve as therapeutic target.

Keywords: AMPK/mTOR; Alzheimer’s disease; Autophagy; FoxG1; NLRP3; β-amyloid.


Conflict of interest statement

The authors declare no competing financial interests.

Figures

Fig. 1
Fig. 1
Construction of FoxG1 stable expression cell lines and FoxG1 induces autophagy in N2A cells. Stable expression of pCDH-FoxG1-m-FLAG-CopGFP-T2A-Puro in mouse N2A cell lines. N2A was stably transfected with pCDH-FoxG1-m-FLAG-CopGFP-T2A-Puro or pCDH-CopGFP-T2A-Puro and selected with puromycin-containing medium. Cell lines were named as FoxG1/N2A and pCDH/N2A cells, respectively. A Green fluorescent proteins are screened positive clones after using 1 μg/mL puromycin 7 days, 14 days, and 21 days, respectively. Scale bar = 100 μm. Expression patterns and qualification of FoxG1 expression in the FoxG1/N2A cell lines and pCDH/N2A cell lines were studied by (B, D [t11 = 3.496, P = 0.025]) western blotting across the protein bands. C Anti-FLAG antibody was also used to check the successful construction of FoxG1 stably expressing cell lines after 14–21 days of puromycin screening. GAPDH or Tubulin was used as the relative loading control. E pCDH/N2A cells were treated with 20 nM Rap for 24 h, protein was then harvested for the detection of Beclin1 and LC3 and SQSTM1/P62 by Western blot in pCDH/N2A cells and FoxG1/N2A cells and Rap treating pCDH/N2A cells. (G [F2,15 = 15.92, P = 0.004]) Bar chart indicates the relative expression of LC3 II/LC3 I in (E). (F [F2,15 = 16.03, P = 0.0039], H [F2,15 = 10.32, P = 0.0114]) Bar chart indicates the relative expression of these proteins in E. GAPDH was used as loading control. I N2A cells transiently transfected with siRNA controller siRNA-FoxG1 for 24 h were treated with 20 nM Rap for 24 h. After treatment, cells were harvested for the detection of Beclin1 and LC3 and SQSTM1/P62 by Western blot. (K [F3,20 = 16.71, P = 0.0008]). Bar chart indicates the expression of LC3 II/LC3 I in (I). (J [F3,20 = 9.676, P = 0.0049], L [F3,20 = 15.44, P = 0.0011]) Bar chart indicates the relative expression of these proteins in I. GAPDH was used as loading control. M Cells were infected with mcherry-GFP-LC3 adenovirus and transfected with vector or FoxG1 plasmid or treated with Rap. Yellow dots indicate autophagosomes and red dots indicate autolysosomes. (N [F2,12 = 11.17, P = 0.0095]) Quantification of autophagosomes in (M). (O [F2,12 = 59.95, P = 0.0001]) Quantification of autolysosomes in (M). Scale bar = 5 μm. For all experiments, different letters indicate statistical differences in mean values across groups (P < 0.05). Values are expressed as means ± SEM. *P < 0.05, **P < 0.01,***P < 0.001. For each group, n = 6/group
Fig. 2
Fig. 2
The 3-MA inhibits autophagy and induces cell apoptosis and death and FoxG1 overexpression alleviates these effects. A Western blot showing the changes in Beclin1, LC3, SQSTM1/P62, and FoxG1 expression in the N2A cells after different concentrations of 3-MA treatment (2.5 mM, 5 mM, 10 mM, 15 mM, and 20 mM) for 24 h. (B [F5,30 = 25.91, P < 0.0001], D [F5,30 = 5.886, P = 0.0056], E [F5,30 = 11.90, P = 0.0003]). Bar chart indicates the relative expression of these proteins in (A). (C [F5,30 = 117.3, P < 0.0001]) Bar chart indicates the expression of LC3 II/LC3 I in (A). (F [F5,30 = 25.59, P < 0.0001]) Cell viability was evaluated by BioTeck. G Apoptosis analysis by flow cytometry after 3-MA treatments for different times (12 h, 24 h, 48 h, and 72 h). (H [F4,25 = 7.982, P = 0.0213], I [F4,25 = 32.06, P = 0.0009]) The proportions of apoptotic cells and dead cells in (G). J FoxG1/N2A cell lines and pCDH/N2A cell lines were treated with 10 mM 3-MA for 48 h, apoptosis analysis by flow cytometry after treatments. (K [F2,15 = 251.9, P < 0.0001], L [F2,15 = 104.1, P < 0.0001]) The proportions of apoptotic cells and dead cells in J. GAPDH was used as western blot loading control. Values are expressed as means ± SEM. *P < 0.05, **P < 0.01, ***P < 0.001. For each group, n = 6/group
Fig. 3
Fig. 3
FoxG1 participates AMPK/mTOR pathway. A The proteins expression of AMPK, p-AMPK, mTOR, and p-mTOR was checked in FoxG1/N2A cells and pCDH/N2A cells by western blot. (B [t10 = 4.715, P = 0.0422], C [t10 = 5.819, P = 0.0283]) Bar chart indicates the expression of p-AMPK/AMPK or p-mTOR/mTOR in (A). D N2A cells transiently transfected with siRNA control or siRNA-FoxG1 for 48 h, and then the cells were harvested for the protein detection of AMPK, p-AMPK, mTOR and p-mTOR. (E [t10 = 5.096, P = 0.0364], F [t10 = 5.093, P = 0.0365]). Bar chart indicates the expression of p-AMPK/AMPK or p-mTOR/mTOR in D. GAPDH was used as loading control. Values are expressed as means ± SEM. *P < 0.05, **P < 0.01, ***P < 0.001. For each group, n = 6/group
Fig. 4
Fig. 4
FoxG1 and autophagy activity decrease with NLRP3 inflammasome increased as Aβ peptides accumulation in N2A cells. N2A cells transiently transfected with vector or APPswe plasmid for 48 h, cells were harvested to check Aβ protein expression, and then the expression of NLRP3, TNF-α, and IL-6 was studied by western blot. (B: NLRP3 [t10 = 2.790, P = 0.0493], TNF-α [t10 = 4.732, P = 0.0091], IL-6 [t10 = 9.740, P = 0.0006]) Bar chart indicates the relative expression of these proteins in (A). C Western blot showing the changes in NLRP3, TNF-α and IL-6, and Beclin1, LC3, SQSTM1/P62, and FoxG1 expression in the N2A cells after different concentration of Aβ25-35 treatment (5 μM, 10 μM, 15 μM, 20 μM, and 25 μM) for 24 h (D: NLRP3 [F5,30 = 36.55, P < 0.0001], TNF-α [F5,30 = 60.83, P < 0.0001], IL-6 [F5,30 = 64.24, P < 0.0001], E Beclin1 [F5,30 = 9.022, P = 0.0009], SQSTM1/P62 [F5,30 = 30.24, P < 0.0001], G [F5,30 = 52.89, P < 0.0001]) bar chart indicates the relative expression of these proteins in (C). (F [F5,30 = 26.53, P < 0.0001]). Bar chart indicates the expression of LC3 II/LC3 I in C. GAPDH was used as loading control. Values are expressed as means ± SEM. *P < 0.05, **P < 0.01,***P < 0.001. For each group, n = 6/group
Fig. 5
Fig. 5
FoxG1 inhibits the Aβ-induced activation of NLRP3 inflammasome via the upregulation of autophagy in N2A cells. A FoxG1/N2A cells and pCDH/N2A cells are transiently transfected with APPswe plasmid for 48 h. The expressions of Aβ, NLRP3, TNF-α and IL-6 were studied by western blot. (B: Aβ [F2,15 = 367.3, P < 0.0001], NLRP3 [F2,15 = 82.98, P < 0.0001], TNF-α [F2,15 = 79.66, P < 0.0001], IL-6 [F2,15 = 54.51, P = 0.0001]). Bar chart indicates the relative expression of these proteins in (A). C N2A cells transiently co-transfected with siRNA control or siRNA-FoxG1 and APPswe plasmid for 48 h; the expressions of NLRP3, TNF-α, and IL-6 were studied by western blot. (D: NLRP3 [t10 = 7.655, P = 0.0016], TNF-α [t10 = 11.80, P = 0.0003], IL-6 [t10 = 11.58, P = 0.0003]). Bar chart indicates the relative expression of these proteins in (C). E FoxG1/N2A cells and pCDH/N2A cells are transiently transfected with APPswe plasmid for 48 h, the expressions of LC3, Beclin1, SQSTM1/P62 and AMPK, p-AMPK, mTOR, and p-mTOR proteins were studied by western blot. (F Beclin1 [F2,15 = 33.89, P = 0.0005], SQSTM1/P62 [F2,15 = 67.36, P < 0.0001]), Bar chart indicates the relative expression of Beclin1 and SQSTM1/P62 in (E). (H [F2,15 = 10.19, P = 0.0118], I [F2,15 = 13.76, P = 0.0057]). Bar chart indicates the expression of p-AMPK/AMPK or p-mTOR/mTOR in (E). (G [F2,15 = 8.809, P < 0.0076]), Bar chart indicates the expression of LC3 II/LC3 I in (E). J FoxG1/N2A cells and pCDH/N2A cells transiently transfected with APPswe plasmid were treated with 10 mM 3-MA for 48 h or no 3-MA treatment. After 48 h, cells were then harvested for the protein detections of NLRP3, TNF-α, and IL-6 by western blot. (K [F5,30 = 21.39, P < 0.0001], L [F5,30 = 25.39, P < 0.0001], M [F5,30 = 34.61, P < 0.0001]). Bar chart indicates the relative expression of these proteins in (J). GAPDH or Tubulin was used as loading control. Values are expressed as means ± SEM. *P < 0.05, **P < 0.01, ***P < 0.001. For each group, n = 6/group
Fig. 6
Fig. 6
Tamoxifen forced FoxG1 overexpressed in the hippocampus of Aβ25-35-induced Cre/FoxG1fl/fl mice and FoxG1 activated autophagy via AMPK/mTOR pathway. The expressions of FoxG1 in the hippocampal sections was detected by the immunohistochemistry method in four groups. The representative images were captured by a microscope. Scale bar = 20 μm. (B [F3,20 = 29.40, P = 0.0001]). Bar chart indicates the qualification of FoxG1 expression. C The expressions of Aβ in the hippocampal tissues was detected by the western blot after Aβ25-35 microinjection, and then detected the proteins of LC3, Beclin1 and SQSTM1/P62. (D: Aβ [F3,20 = 29.11, P = 0.0001], Beclin1 [F3,20 = 7.912, P = 0.0089], SQSTM1/P62 [F3,20 = 4.126, P = 0.0484]). Bar chart indicates the relative expression of these proteins in (C). (E [F3,20 = 12.07, P = 0.0179]) Bar chart indicates the expression of LC3 II/LC3 I in (C). F TEM analysis for evaluating autophagy in four groups. Scale bar = 0.5 μm. (G autophagic vacuoles [F3,9 = 22.07, P = 0.0060], autolysosomes[F3,9 = 3.564, P = 0.1256]) Quantification of the autophagic vacuoles and the autolysosomes in (F). H The expression of AMPK, p-AMPK, mTOR, and p-mTOR proteins were studied by western blot in four groups. (I [F3,20 = 36.91, P = 0.0023], J [F3,20 = 48.38, P = 0.0013]). Bar chart indicates the expression of p-AMPK/AMPK or p-mTOR/mTOR in (H). GAPDH was used as loading control. For all experiments, different letters indicate statistical differences in mean values across groups (P < 0.05). Values are expressed as means ± SEM. *P < 0.05, **P < 0.01, ***P < 0.001. For each group, n = 6/group
Fig. 7
Fig. 7
FoxG1 improves the cognitive function and inhibits the NLRP3 inflammasome in Aβ25-35-induced Cre/FoxG1fl/fl mice. Representative images of escape latency (A) and time spent in the target platform quadrant in probe 1 (B [F3,20 = 3.732, P = 0.0247]) and in probe 2 (C [F3,20 = 3.573, P = 0.0288]) were recorded and obtained by the Morris water maze (MWM) test system. Bar charts indicate the recognition index in novel object recognition (D [F3,20 = 5.178, P = 0.0109]) and in novel place recognition (E [F3,20 = 4.094, P = 0.0247]). Data are presented as mean ± SEM, n = 6/group. After behavioral experiments, the mice were anesthetized and taken brain tissue. F Immunofluorescence staining with NLRP3 antibody in the hippocampus from four-group mice. (G [t10 = 8.018, P = 0.0013]) Quantification of the NLRP3 spot number in (F). H The expression of NLRP3, TNF-α, and IL-6 were studied by western blot. GAPDH was used as loading control. (I: NLRP3 [F3,20 = 1.593, P = 0.3238], TNF-α [F3,20 = 8.426, P = 0.0334], IL-6 [F3,20 = 5.217, P = 0.0722]). Bar chart indicates the relative expression of these proteins in (H). J Immunofluorescence co-staining with Aβ antibody and GFAP antibody in the hippocampus from four-group mice, GFAP spots were emerged with Aβ depositions. Quantification of the (K [F3,20 = 223.1, P < 0.0001]) Aβ plaque number and (L [F3,20 = 44.01, P = 0.0016]). GFAP spot number in (J). For all experiments, different letters indicate statistical differences in mean values across groups (P < 0.05). Values are expressed as means ± SEM. *P < 0.05, **P < 0.01, ***P < 0.001. For each group, n = 6/group

Similar articles

Cited by

References

    1. Abad-Jiménez Z, López-Domènech S, García-Gargallo C, Vezza T, Gómez-Abril SÁ, Morillas C, Díaz-Pozo P, Falcón R, Bañuls C, Víctor VM, Rocha M (2022) Roux-en-Y gastric bypass modulates AMPK, autophagy and inflammatory response in leukocytes of obese patients. Biomedicines. 10.3390/biomedicines10020430 - PMC - PubMed
    1. Abedin F, Kandel N, Tatulian SA (2021) Effects of Aβ-derived peptide fragments on fibrillogenesis of Aβ. Sci Rep 11(1):19262. 10.1038/s41598-021-98644-y - PMC - PubMed
    1. Adesina AM, Veo BL, Courteau G, Mehta V, Wu X, Pang K, Liu Z, Li X-N, Peters L (2015) FOXG1 expression shows correlation with neuronal differentiation in cerebellar development, aggressive phenotype in medulloblastomas, and survival in a xenograft model of medulloblastoma. Hum Pathol 46(12):1859–1871. 10.1016/j.humpath.2015.08.003 - PubMed
    1. Ahmed ME, Iyer S, Thangavel R, Kempuraj D, Selvakumar GP, Raikwar SP, Zaheer S, Zaheer A (2017) Co-localization of glia maturation factor with NLRP3 inflammasome and autophagosome markers in human Alzheimer’s disease brain. J Alzheimers Dis 60(3):1143–1160. 10.3233/JAD-170634 - PMC - PubMed
    1. Aizawa S, Hoki M, Yamamuro Y (2017) Lactoferrin promotes autophagy via AMP-activated protein kinase activation through low-density lipoprotein receptor-related protein 1. Biochem Biophys Res Commun 493(1):509–513. 10.1016/j.bbrc.2017.08.160 - PubMed

Substances