. 2024 Jun 1;35(6):mr3.
doi: 10.1091/mbc.E24-02-0093. Epub 2024 Apr 17.

A methodology for specific disruption of microtubule polymerization into dendritic spines

Affiliations

A methodology for specific disruption of microtubule polymerization into dendritic spines

Elizabeth D Holland et al. Mol Biol Cell. .

Abstract

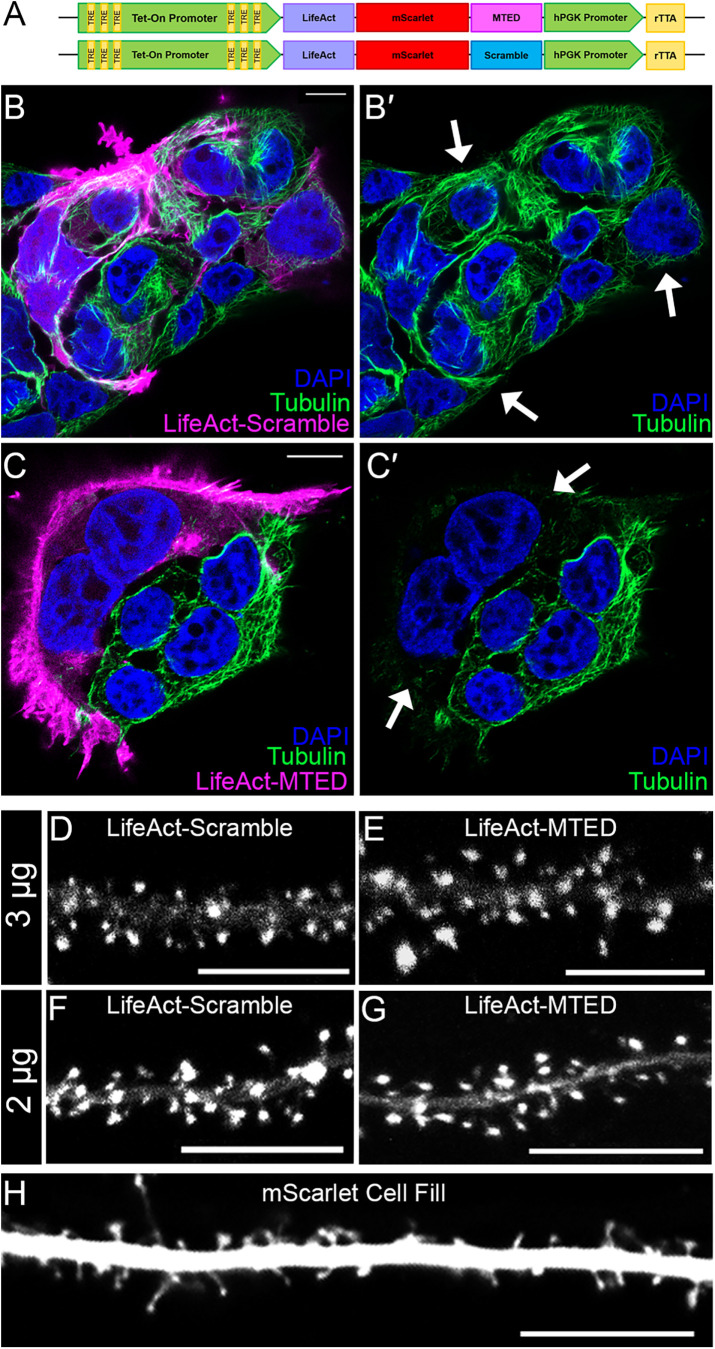
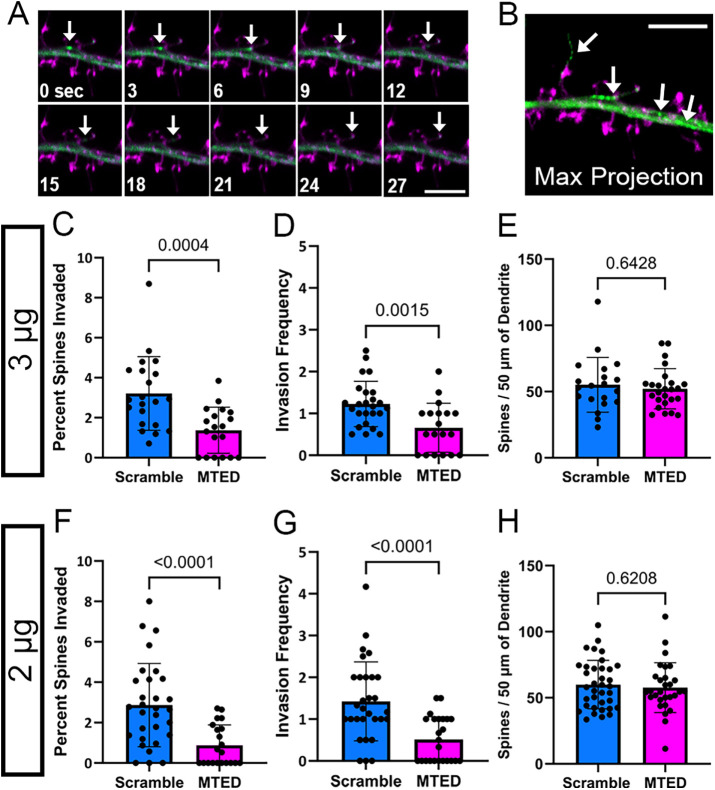
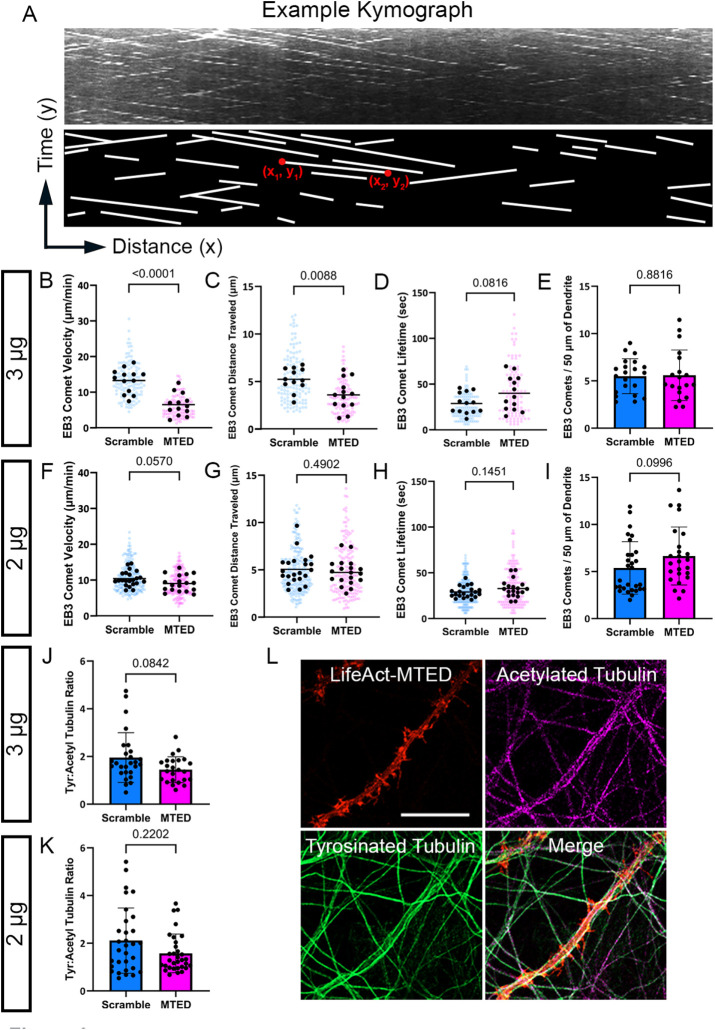
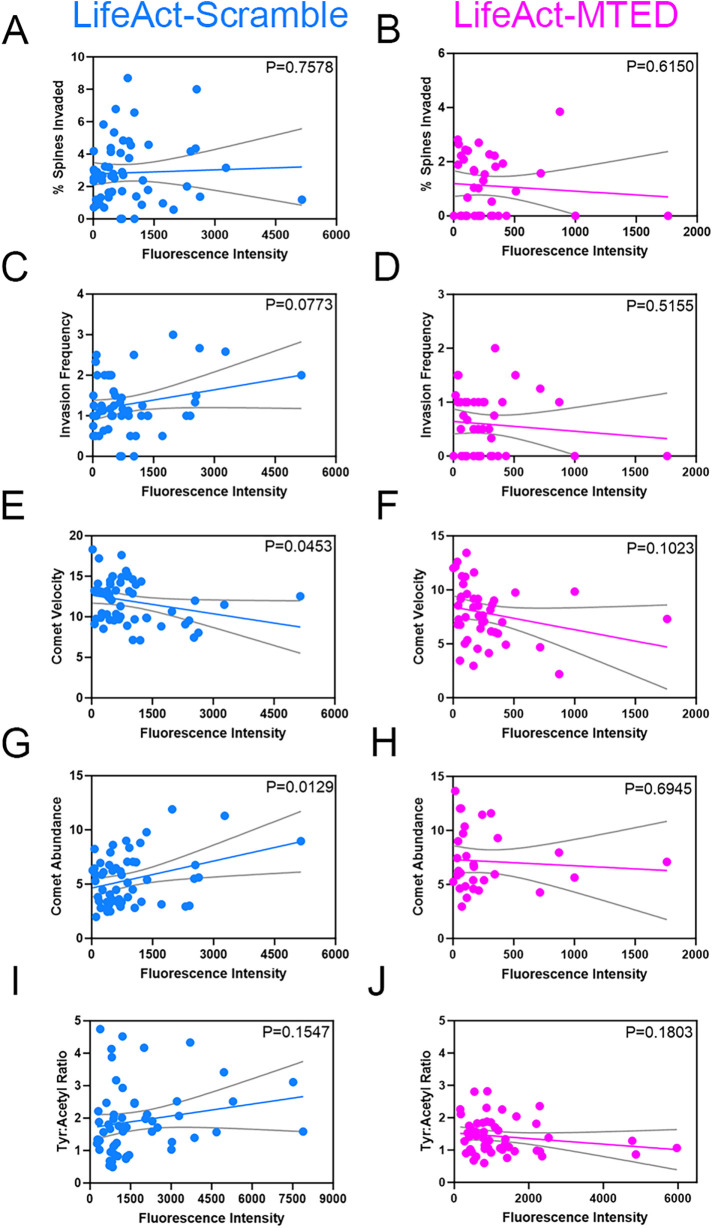
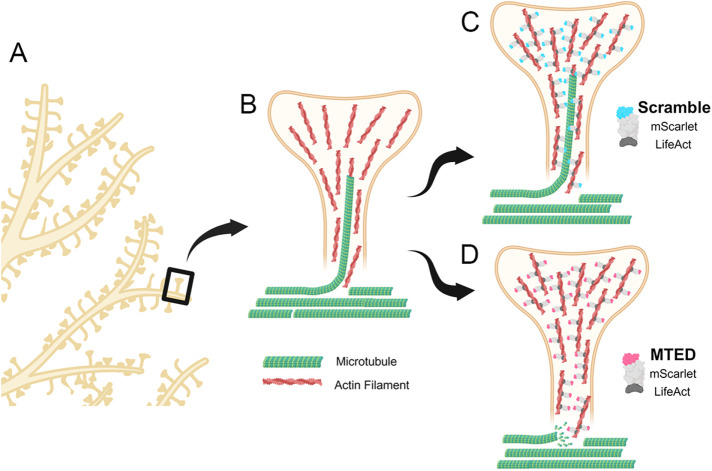
Dendritic spines, the mushroom-shaped extensions along dendritic shafts of excitatory neurons, are critical for synaptic function and are one of the first neuronal structures disrupted in neurodevelopmental and neurodegenerative diseases. Microtubule (MT) polymerization into dendritic spines is an activity-dependent process capable of affecting spine shape and function. Studies have shown that MT polymerization into spines occurs specifically in spines undergoing plastic changes. However, discerning the function of MT invasion of dendritic spines requires the specific inhibition of MT polymerization into spines, while leaving MT dynamics in the dendritic shaft, synaptically connected axons and associated glial cells intact. This is not possible with the unrestricted, bath application of pharmacological compounds. To specifically disrupt MT entry into spines we coupled a MT elimination domain (MTED) from the Efa6 protein to the actin filament-binding peptide LifeAct. LifeAct was chosen because actin filaments are highly concentrated in spines and are necessary for MT invasions. Temporally controlled expression of this LifeAct-MTED construct inhibits MT entry into dendritic spines, while preserving typical MT dynamics in the dendrite shaft. Expression of this construct will allow for the determination of the function of MT invasion of spines and more broadly, to discern how MT-actin interactions affect cellular processes.


Figures

FIGURE 1:
FIGURE 1:
Design of the MTMTED plasmid construct. (A) Schematic of MTED and scramble plasmid constructs containing Tet-On doxycycline inducible promoter (green) with tet-response elements (yellow), LifeAct (purple)-mScarlet (red)-MTED/scramble (magenta/blue) fusion protein sequence, separate hPGK promoter (green) and constitutively active rTTa gene sequence (yellow). (B–C’) Confocal images of fixed HEK293T cells transfected with the LifeAct-scramble (B and B’) or LifeAct-MTED (C and C’) plasmid construct and immunostained for beta-tubulin (green) with cell nuclei stained blue (DAPI). The leftmost panels (B and C) show transfected cells in magenta while the corresponding panels on the right (B’ and C’) show the same image, without the magenta overlay. Arrows in B’ and C’ point to transfected cells that contain MTs (B’) or lack MTs (C’). (D–H) Confocal images of living primary hippocampal neurons (DIV 21–25) transfected with 3 μg LifeAct-scramble (D), 3 μg LifeAct-MTED (E), 2 μg LifeAct-scramble (F), 2 μg LifeAct-MTED (G) or mScarlet fluorescent cell fill (H). All scale bars are 10 µm.
FIGURE 2:
FIGURE 2:
Reduction of MT invasions into dendritic spines within LifeAct-MTED transfected hippocampal neurons. (A) Confocal time-series of living mature hippocampal neuron (DIV 23) taken at 3-s intervals. The neuron was transfected with LifeAct-scramble (magenta) and mNeon EB3 (green) plasmid constructs. Invading EB3 comet is shown with a white arrow in each frame. (B) Corresponding maximum intensity projection of the time-series shown in A. Traces of an invading EB3 comet, as well as EB3 comets within the dendritic shaft, are shown in green and are identified by white arrows. Dendritic spines of the transfected neuron are shown in magenta. Scale bars are 5 µm (A and B). (C–H) Bar graphs show mean ± SD and black dots are individual dendritic segments. (C) Quantification of percent of dendritic spines invaded (number of invaded dendritic spines/total number of dendritic spines within field of view) for neurons transfected with 3 μg of LifeAct-scramble or LifeAct-MTED plasmid (n = 21 scramble, n = 19 MTED from five separate biological replicates for both C and D). (D) Quantification of invasion frequency (total number of invasions throughout the course of a time-series containing 100 frames/invaded dendritic spines within field of view) for neurons transfected with 3 μg of LifeAct-scramble or LifeAct-MTED plasmid. (E) Quantification of dendritic spine density normalized to 50 µm dendritic segments for neurons transfected with 3 μg of LifeAct-scramble or LifeAct-MTED (n = 20 scramble, n = 25 MTED from six separate biological replicates). (F) Quantification of percent of dendritic spines invaded for neurons transfected with 2 μg of LifeAct-scramble or LifeAct-MTED (n = 30 scramble, n = 21 MTED from five separate biological replicates for both F and G). (G) Quantification of invasion frequency for neurons transfected with 2 μg of LifeAct-scramble or LifeAct-MTED plasmid. (H) Quantification of dendritic spine density normalized to 50 µm dendritic segments for neurons transfected with 2 μg of LifeAct-scramble or LifeAct-MTED (n = 36 scramble, n = 29 MTED from six separate biological replicates). P values in (C–H) shown above bars are calculated with two-tailed Student’s t test or Mann-Whitney depending on normality of data distribution.
FIGURE 3:
FIGURE 3:
Limited off-target effects following transfection of LifeAct-MTED in mature hippocampal neurons. (A) Representative kymograph, a graphical representation of EB3 comet spatial position over time, with corresponding illustration below for simplified visualization. Each white line is representative of a single, moving EB3 comet. Coordinates of the beginning (x1,y1) and end (x2,y2) of an example line are used for calculation of distance traveled (difference in x value) and how long the comet was visualized, also referred to as the comet “lifetime” (difference in y value). (B–D) Scatter plots displaying EB3 comet velocity (B), EB3 comet distance traveled (C), and EB3 comet lifetime (D) obtained from neurons transfected with 3 μg of LifeAct-MTED or LifeAct-scramble. Mean is shown by a black bar. Each black dot is representative of the average measurement per neuron ((B) n = 13 scramble, n = 13 MTED; (C) n = 12 scramble, n = 13 MTED; (D) n = 13 scramble, n = 13 MTED from four separate biological replicates), while the blue or magenta dots in the background represent individual EB3 comet measurements ((B) n = 125 scramble, n = 108 MTED; (C) n = 121 scramble, n = 105 MTED; (D) n = 118 scramble, n = 107 MTED). (E) Quantification of EB3 comet abundance (number of comets per 50 μm of dendrite) within the dendritic shaft of neurons transfected with 3 μg of LifeAct-MTED or LifeAct-scramble. Bar graph shows mean ± SD and black dots are individual dendritic segments (n = 21 scramble, n = 19 MTED from five separate biological replicates). (F–H) Scatter plots displaying EB3 comet velocity (F), EB3 comet distance traveled (G), and EB3 comet lifetime (H) obtained from neurons transfected with 2 μg of LifeAct-MTED or LifeAct-scramble. Mean is shown by a black bar. Each black dot is representative of the average measurement per neuron ((F) n = 22 scramble, n = 18 MTED; (G) n = 22 scramble, n = 18 MTED; (H) n = 21 scramble, n = 18 MTED from five separate biological replicates), while the blue or magenta dots in the background represent individual EB3 comet measurements ((F) n = 195 scramble, n = 164 MTED; (G) n = 192 scramble, n = 165 MTED; (H) n = 187 scramble, n = 161 MTED). (I) Quantification of EB3 comet abundance within the dendritic shaft of neurons transfected with 2 μg of LifeAct-MTED or LifeAct-scramble. Bar graph shows mean ± SD and black dots are individual dendritic segments (n = 29 scramble, n = 25 MTED from five separate biological replicates). (J and K) Ratio of tyrosinated tubulin:acetylated tubulin within the dendritic shaft of neurons transfected with either 3 μg (J) (n = 27 scramble, n = 24 MTED) or 2 μg (K) (n = 31 scramble, n = 32 MTED) of LifeAct-MTED or LifeAct-scramble from three separate biological replicates. Bar graph shows mean ± SD and black dots are individual dendritic segments. (L) Representative confocal images of fixed, hippocampal neurons transfected with the Life-Act MTED (red) and stained for acetylated tubulin (magenta) and tyrosinated tubulin (green). Such images were used for quantification of tyrosinated tubulin:acetylated tubulin ratios (J and K). P values in (B–K) shown above bars are calculated with two-tailed Student’s t test or Mann-Whitney depending on normality of data distribution.
FIGURE 4:
FIGURE 4:
Correlation between LifeAct-MTED/scramble expression levels and MT dynamics. (A–J) Scatter plots of expression levels of LifeAct-scramble (A, C, E, G, and I) or LifeAct-MTED (B, D, F, H, and J) within hippocampal neurons, as measured by fluorescent intensity of the cell dendrite. Linear regression lines (colored) and 95% confidence intervals (gray) were plotted to compare percent spines invaded (A and B), invasion frequency (C and D), EB3 comet velocity (E and F), EB3 comet abundance (G and H) and tyrosinated tubulin:acetylated tubulin ratios (I and J) to the fluorescent intensity values. The slope of each linear regression line was analyzed for whether it significantly differed from zero, with the p value being displayed in the upper right corner of each graph. N = 57 (A), n = 40 (B), n = 54 (C), n = 42 (D), n = 57 (E), n = 44 (F), n = 56 (G), n = 31 (H), n = 57 (I), n = 52 (J) from 16 separate biological replicates.
FIGURE 5:
FIGURE 5:
Lack of correlation between EB3 comet velocity and MT invasion of dendritic spines. (A–D) Scatter plots of average EB3 comet velocity within hippocampal neurons transfected with LifeAct-scramble (A and C) or LifeAct-MTED (B and D). Linear regression lines (colored) and 95% confidence intervals (gray) were plotted against metrics measuring likelihood of MT polymerization into dendritic spines, including percent spines invaded (A and B) and invasion frequency (C and D). The slope of each linear regression line was analyzed for whether it significantly differed from zero, with the p value being displayed in the upper right corner of each graph. N = 57 (A), n = 34 (B), n = 54 (C), n = 34 (D) from 11 separate biological replicates.
FIGURE 6:
FIGURE 6:
Schematic of LifeAct-MTED/scramble effects on MT invasions of dendritic spines. (A) Section of a representative dendritic arbor with one spine boxed. (B) Representative dendritic spine (yellow) rich with f-actin (red filaments) being invaded by a polymerizing MT (green). Other noninvading MTs are shown in the dendrite shaft (unpublished data). (C) Dendritic spine (yellow) of neuron transfected with LifeAct-scramble (blue and gray fusion protein) that is appropriately localizing to actin filaments (red) but does not affect the likelihood of a MT (green) directly polymerizing into the dendritic spine. (D) Dendritic spine (yellow) of neuron transfected with LifeAct-MTED (pink and gray fusion protein) that has localized to actin filaments (red) in the spine head and neck. LifeAct-MTED is shown depolymerizing a MT (green) before its entry into the dendritic spine. Created with BioRender.com.

Update of

Similar articles

Cited by

References

    1. Barnes SJ, Opitz T, Merkens M, Kelly T, von der Brelie C, Krueppel R, Beck H (2010). Stable mossy fiber long-term potentiation requires calcium influx at the granule cell soma, protein synthesis, and microtubule-dependent axonal transport. J Neurosci 30, 12996–13004. - PMC - PubMed
    1. Bindels DS, Haarbosch L, van Weeren L, Postma M, Wiese KE, Mastop M, Aumonier S, Gotthard G, Royant A, Hink MA, Gadella TW, Jr. (2017). mScarlet: a bright monomeric red fluorescent protein for cellular imaging. Nat Methods 14, 53–56. - PubMed
    1. Borowiak M, Nahaboo W, Reynders M, Nekolla K, Jalinot P, Hasserodt J, Rehberg M, Delattre M, Zahler S, Vollmar A, et al. (2015). Photoswitchable Inhibitors of Microtubule Dynamics Optically Control Mitosis and Cell Death. Cell 162, 403–411. - PubMed
    1. Dent EW, Kalil K. (2001). Axon branching requires interactions between dynamic microtubules and actin filaments. J Neurosci 21, 9757–9769. - PMC - PubMed
    1. Dent EW, Meiri KF (1992). GAP-43 phosphorylation is dynamically regulated in individual growth cones. J Neurobiol 23, 1037–1053. - PubMed

Publication types

LinkOut - more resources