

Comparison of Bayesian Coalescent Skyline Plot Models for Inferring Demographic Histories
- PMID: 38630635
- PMCID: PMC11068272
- DOI: 10.1093/molbev/msae073
Comparison of Bayesian Coalescent Skyline Plot Models for Inferring Demographic Histories
Abstract
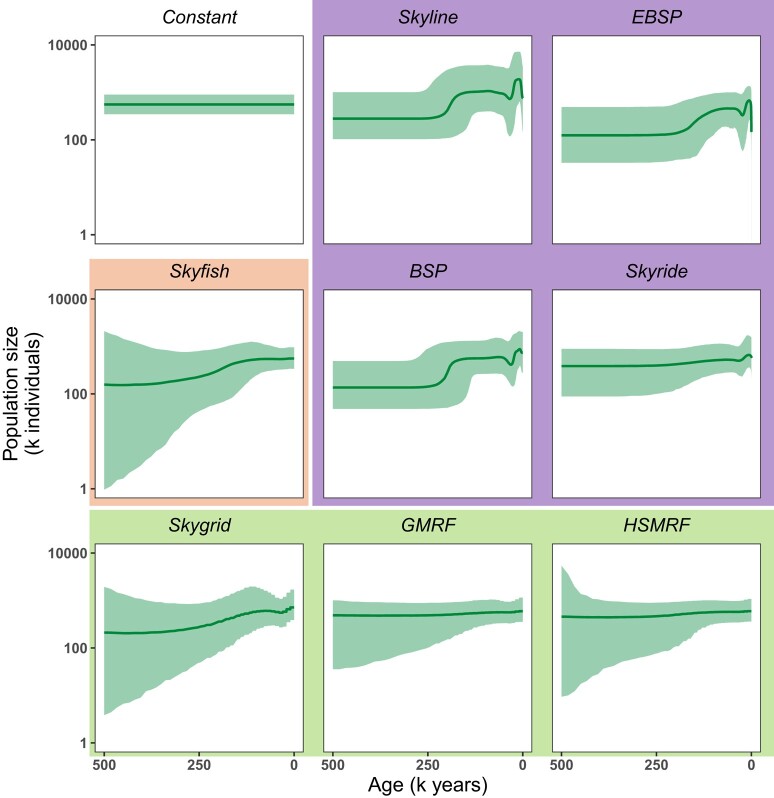
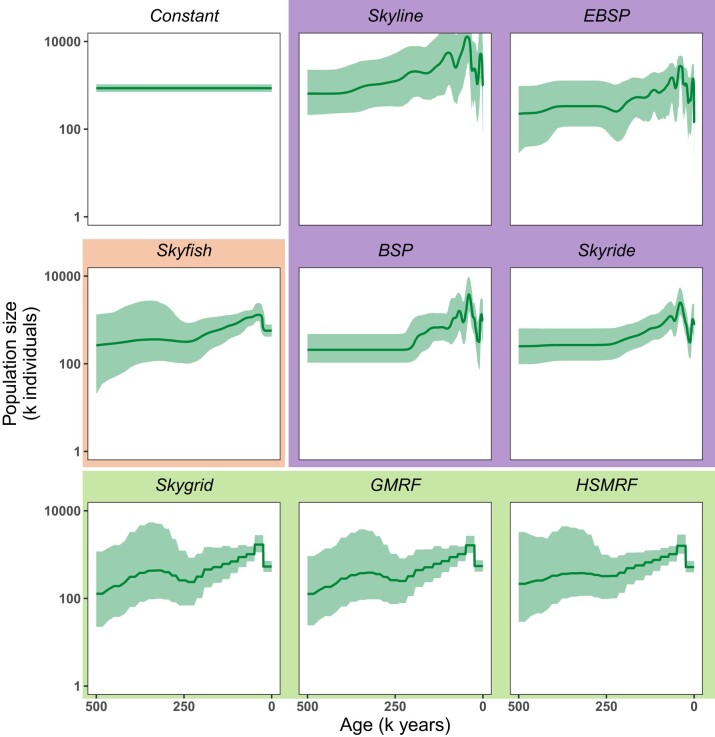
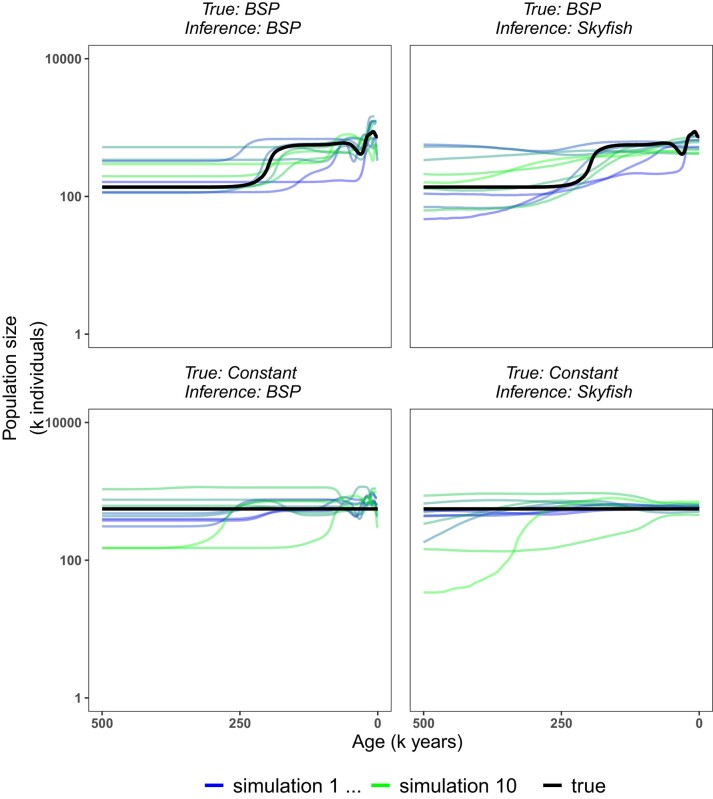
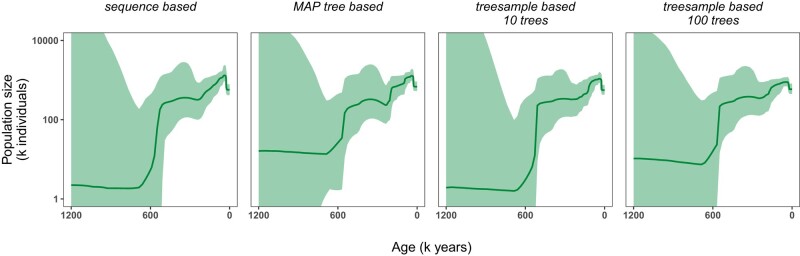
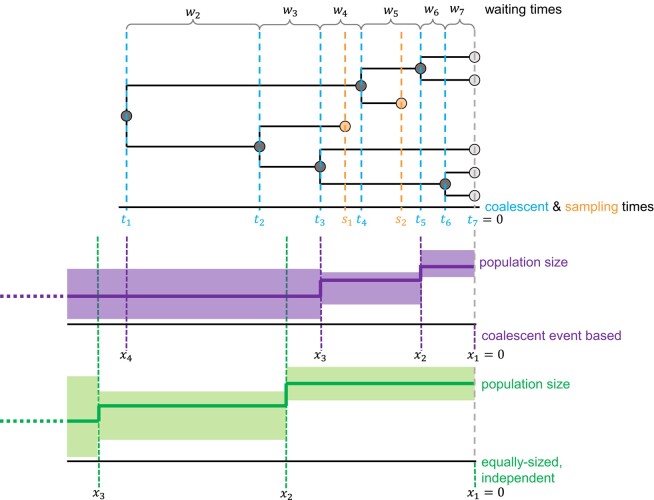
Bayesian coalescent skyline plot models are widely used to infer demographic histories. The first (non-Bayesian) coalescent skyline plot model assumed a known genealogy as data, while subsequent models and implementations jointly inferred the genealogy and demographic history from sequence data, including heterochronous samples. Overall, there exist multiple different Bayesian coalescent skyline plot models which mainly differ in two key aspects: (i) how changes in population size are modeled through independent or autocorrelated prior distributions, and (ii) how many change-points in the demographic history are used, where they occur and if the number is pre-specified or inferred. The specific impact of each of these choices on the inferred demographic history is not known because of two reasons: first, not all models are implemented in the same software, and second, each model implementation makes specific choices that the biologist cannot influence. To facilitate a detailed evaluation of Bayesian coalescent skyline plot models, we implemented all currently described models in a flexible design into the software RevBayes. Furthermore, we evaluated models and choices on an empirical dataset of horses supplemented by a small simulation study. We find that estimated demographic histories can be grouped broadly into two groups depending on how change-points in the demographic history are specified (either independent of or at coalescent events). Our simulations suggest that models using change-points at coalescent events produce spurious variation near the present, while most models using independent change-points tend to over-smooth the inferred demographic history.
Keywords: RevBayes; coalescent; demographic histories; heterochronous samples.
© The Author(s) 2024. Published by Oxford University Press on behalf of Society for Molecular Biology and Evolution.
Figures
Similar articles
-
Multiple merger coalescent inference of effective population size.Philos Trans R Soc Lond B Biol Sci. 2025 Feb 13;380(1919):20230306. doi: 10.1098/rstb.2023.0306. Epub 2025 Feb 20. Philos Trans R Soc Lond B Biol Sci. 2025. PMID: 39976412 Free PMC article.
-
Are Skyline Plot-Based Demographic Estimates Overly Dependent on Smoothing Prior Assumptions?Syst Biol. 2021 Dec 16;71(1):121-138. doi: 10.1093/sysbio/syab037. Syst Biol. 2021. PMID: 33989428 Free PMC article.
-
The confounding effect of population structure on Bayesian skyline plot inferences of demographic history.PLoS One. 2013 May 7;8(5):e62992. doi: 10.1371/journal.pone.0062992. Print 2013. PLoS One. 2013. PMID: 23667558 Free PMC article.
-
Skyline-plot methods for estimating demographic history from nucleotide sequences.Mol Ecol Resour. 2011 May;11(3):423-34. doi: 10.1111/j.1755-0998.2011.02988.x. Epub 2011 Feb 6. Mol Ecol Resour. 2011. PMID: 21481200 Review.
-
Problems and Cautions With Sequence Mismatch Analysis and Bayesian Skyline Plots to Infer Historical Demography.J Hered. 2015 Jul-Aug;106(4):333-46. doi: 10.1093/jhered/esv020. Epub 2015 Apr 29. J Hered. 2015. PMID: 25926628 Review.
Cited by
-
Sex-biased Migration and Demographic History of the Big European Firefly Lampyris noctiluca.Mol Biol Evol. 2025 Jun 4;42(6):msaf123. doi: 10.1093/molbev/msaf123. Mol Biol Evol. 2025. PMID: 40542536 Free PMC article.
-
Bayesian StairwayPlot for Inferring Single Population Demographic Histories From Site Frequency Spectra.Mol Ecol Resour. 2025 Aug;25(6):e14087. doi: 10.1111/1755-0998.14087. Epub 2025 Feb 26. Mol Ecol Resour. 2025. PMID: 40012349 Free PMC article.
-
Accounting for reporting delays in real-time phylodynamic analyses with preferential sampling.PLoS Comput Biol. 2025 May 6;21(5):e1012970. doi: 10.1371/journal.pcbi.1012970. eCollection 2025 May. PLoS Comput Biol. 2025. PMID: 40327728 Free PMC article.
References
-
- Baele G, Lemey P. Bayesian model selection in phylogenetics and genealogy-based population genetics. In: Bayesian phylogenetics, methods, algorithms, and applications. 2014. New York: Chapman and Hall/CRC. p. 59–93.
Publication types
MeSH terms
Grants and funding
LinkOut - more resources
Full Text Sources
